Prototype 1
Prototype 1 Description:
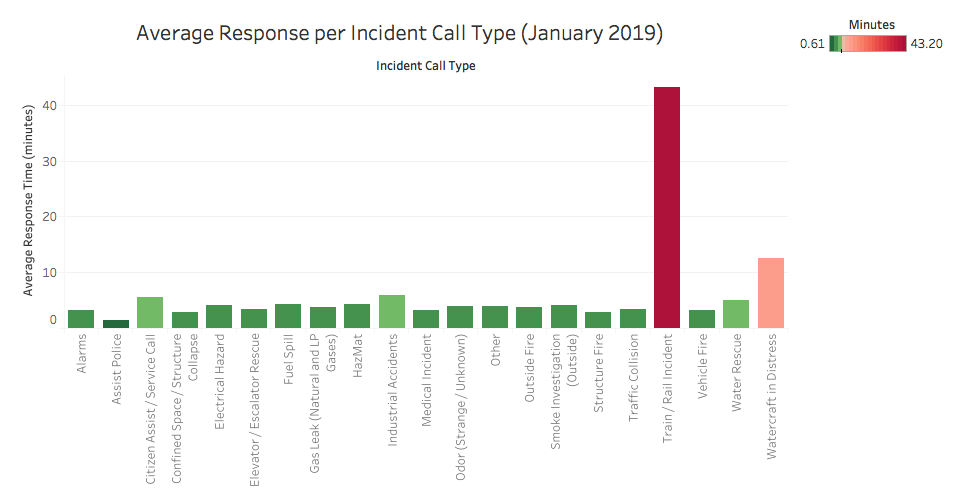
Displays the average response time in minutes for
call types that had valid data and that the San Francisco
Fire Department responded to in January 2019. Less common incidents such as
train/rail incidents and watercraft in distress calls have slow
response time whereas many common incidents such as medical
incident, structure fire, and assisting
police have very fast reponse times.
Prototype 2
Prototype 2 Description:
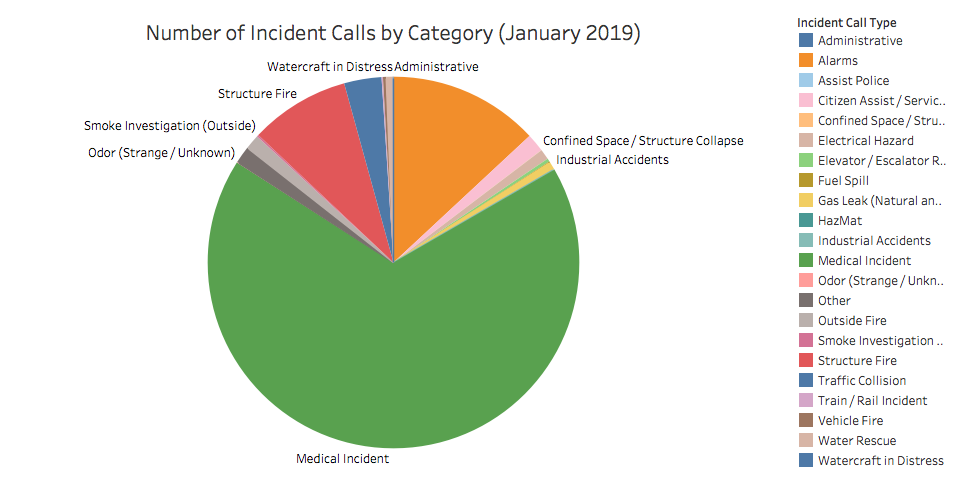
Shows the most common calls that the San Francisco Fire Department received for the
month of January 2019. Medical incident was the most common
call type by far. The next most common were alarm calls and
structure fire calls. You can use prototype 1 to see the averge
response time for these common call types.
Prototype 3
Prototype 3 Description:
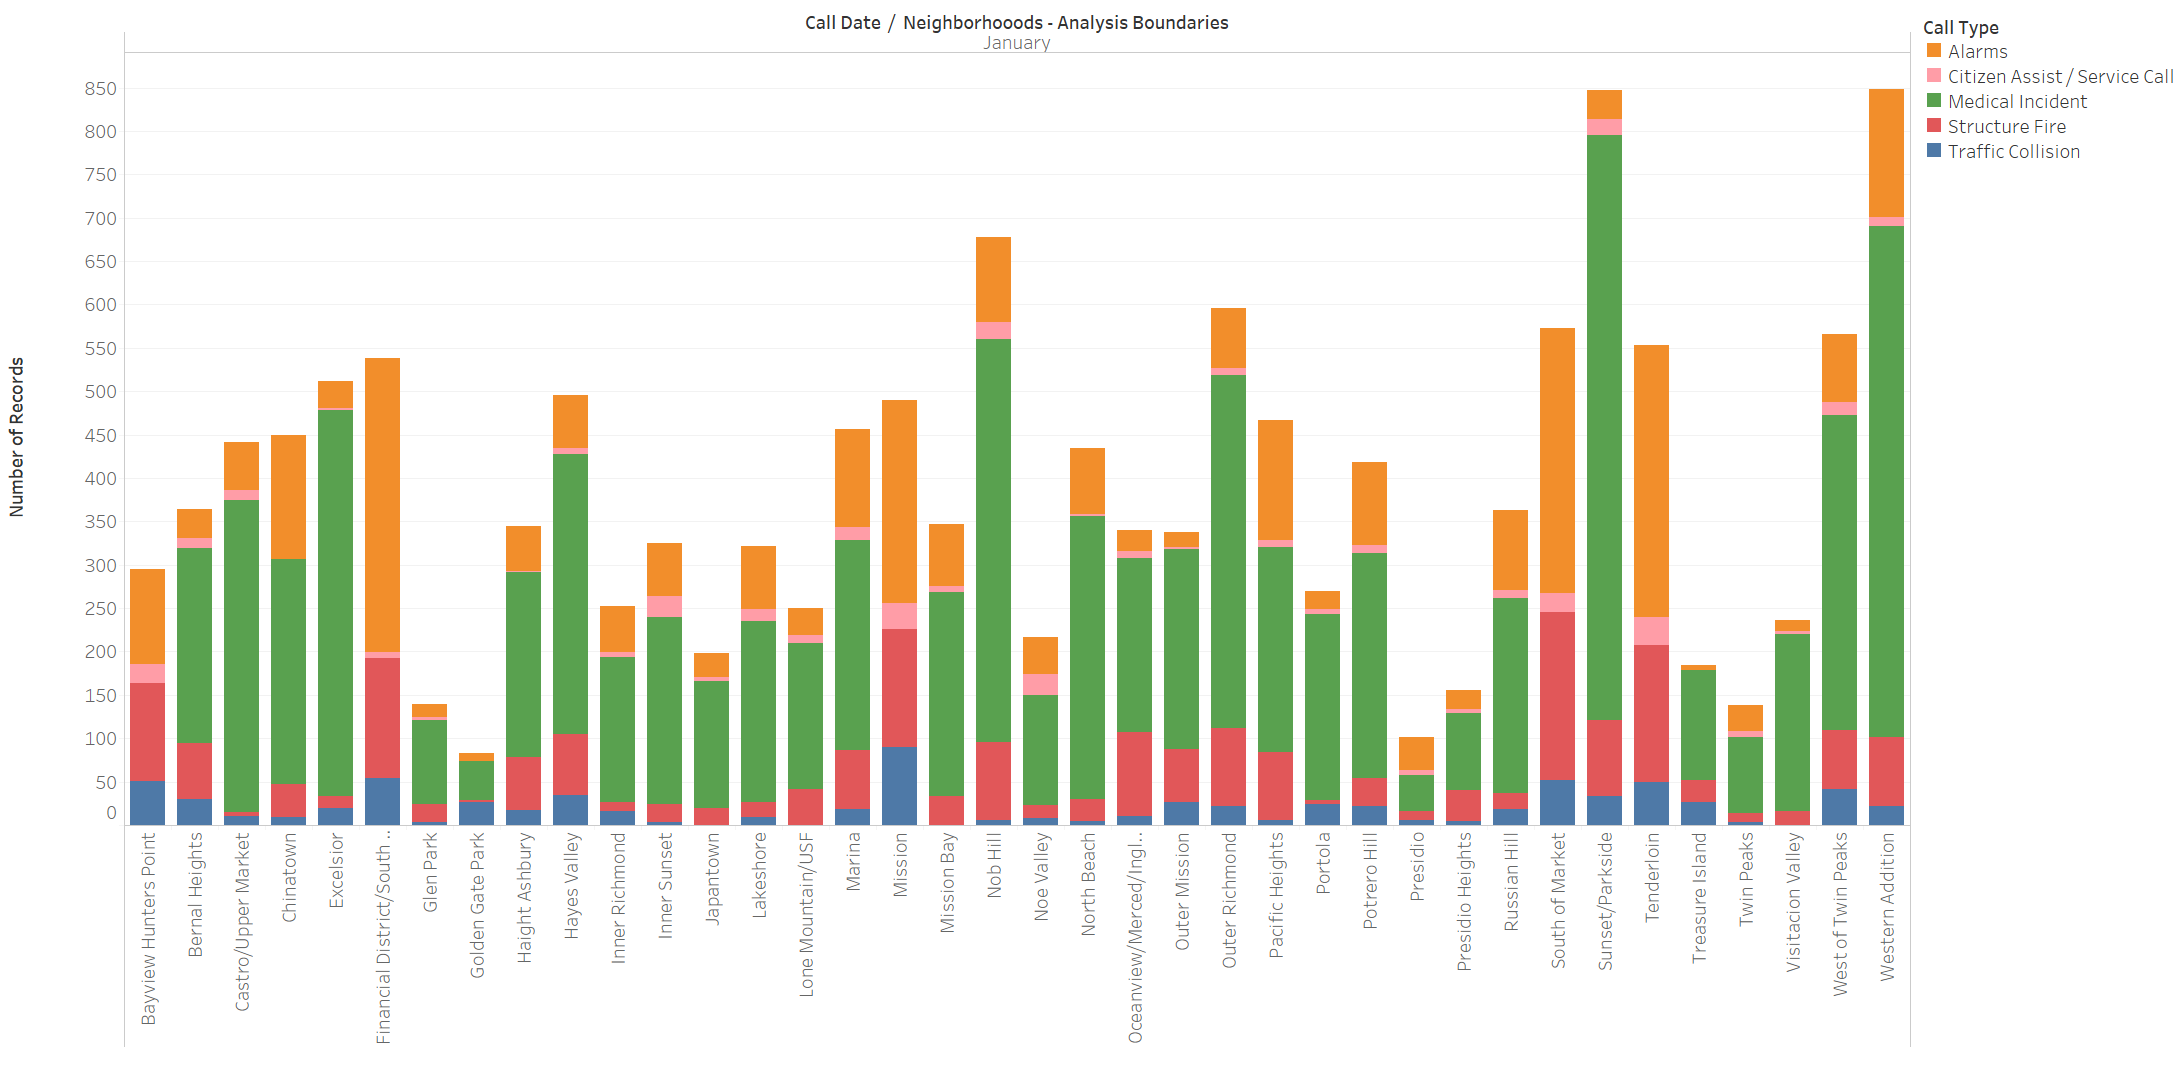
Shows the sum of records broken down by neighborhood for the month of January 2019 and the four most common call types.
The color coding shows the call type for each neighborhood.
As expected from prototype 1 and prototype 2, medical incident
is the most common call type. An interesting data point is the
high level of alarm calls in the financial district.
Prototype 4

Prototype 4 Description:
Shows the average response time(Difference between Received DtTm & On Scene DtTm) of all Neighborhoods of 4 most frequent Call Types in January 2019.
Prototype 5
Prototype 5 Description:
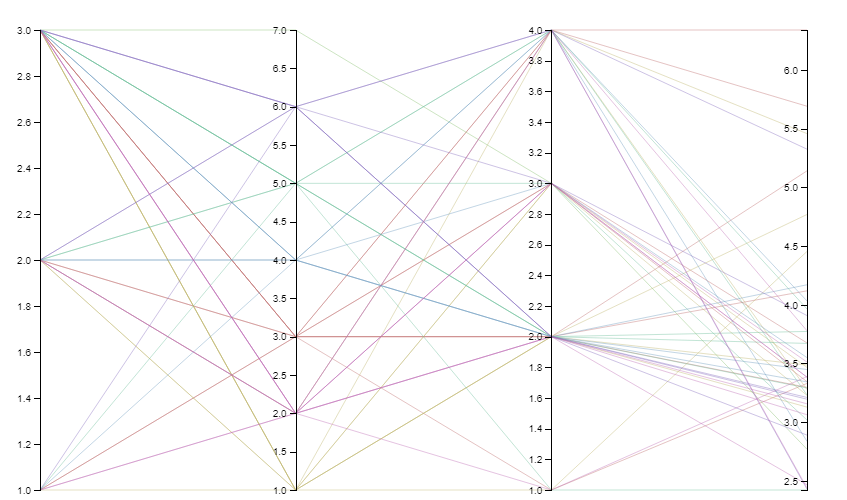
Describes the average response time based on 3 different dimentions:
The call priority, unit type, and call type in January 2019.
Prototype 6
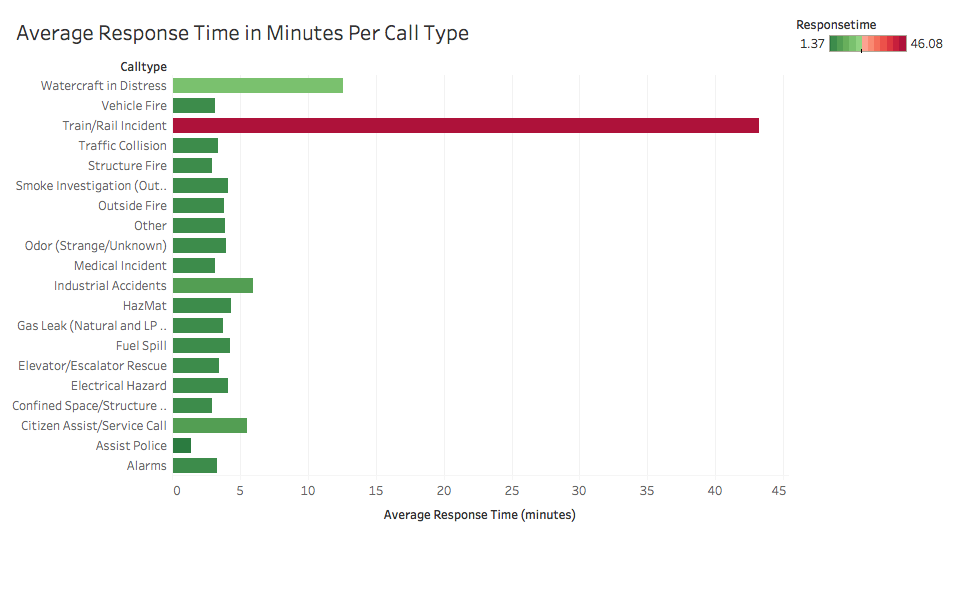
Prototype 6 Description:
Shows average response time in minutes for each call category. Red coloring is slower and green is faster average
response time.
Feedback
- Prototype 1:
Rotate the graph for better readability
Expand the green color scale for better recognization
Add buttons to showcase different values - Prototype 2:
Truncate some less important Call Types - Prototype 3:
Rotate the graph for better readability
Sort the Call Type
Less related content, could dig deeper into response time.