Descriptions
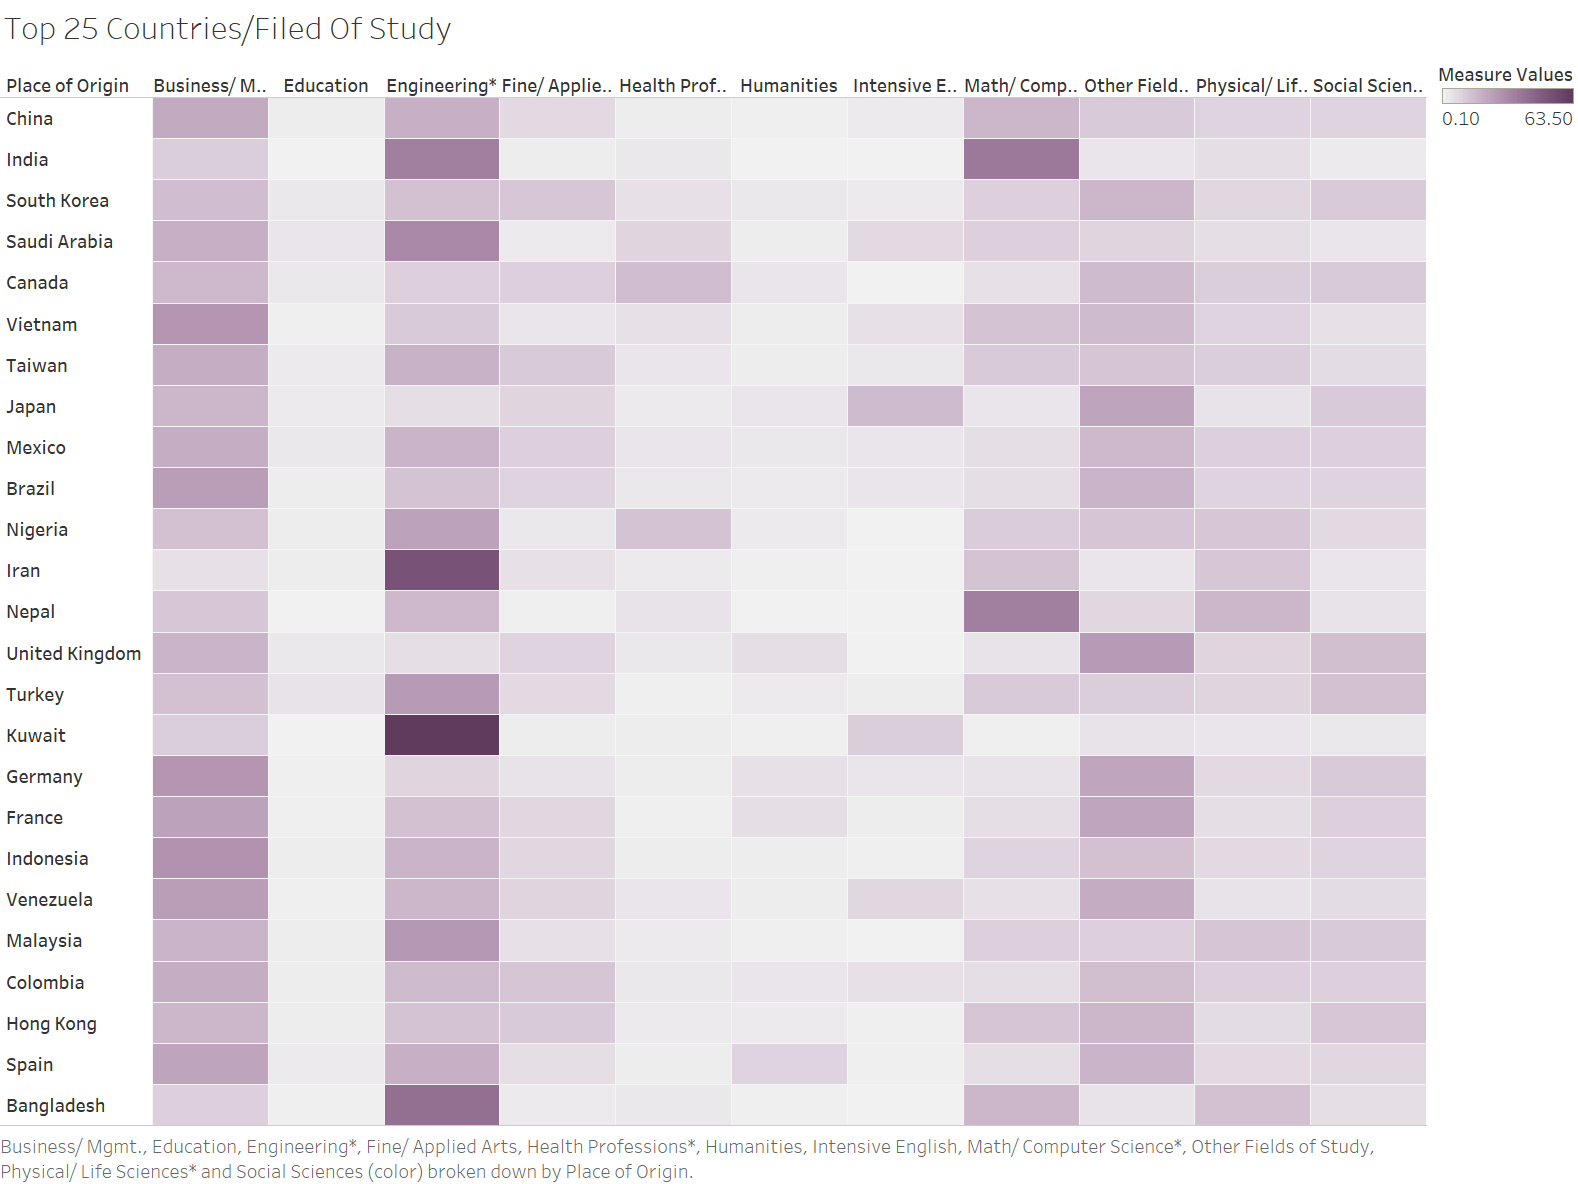
- Goal: Visualize Top 25 countries (international students' place of origin), and fileds of study acording to each country so it can help us to understand the academic direction that each country moves toward.
- Interactivity:The first two visualizations are interactive, by mouseover it will highlight the selected part and it's related legend label, so users can compare different countries. The last prototype has been done in Tableau the interactive part is by mouse over shows the information such as the filed of study, country, and percentage related to that box next to mouse pointer.
*All three visualizations below showing the same data and one of these visualizations will be selected for the D3 implementation.
Prototype#1
Details:
Prototype#2
Details:
Prototype#3

Details:
Descriptions Beta Release
- Goal: Visualize Top 26 countries (international students' place of origin), and academic levels acording to each country so it can help us to understand the academic direction that each country moves toward.
- Interactivity:The visualization is interactive, filters the data based on acadic level, by mouse over will show the actual number of students studying in that academic level.