Prototype 2

Visualization 2
Interpretation
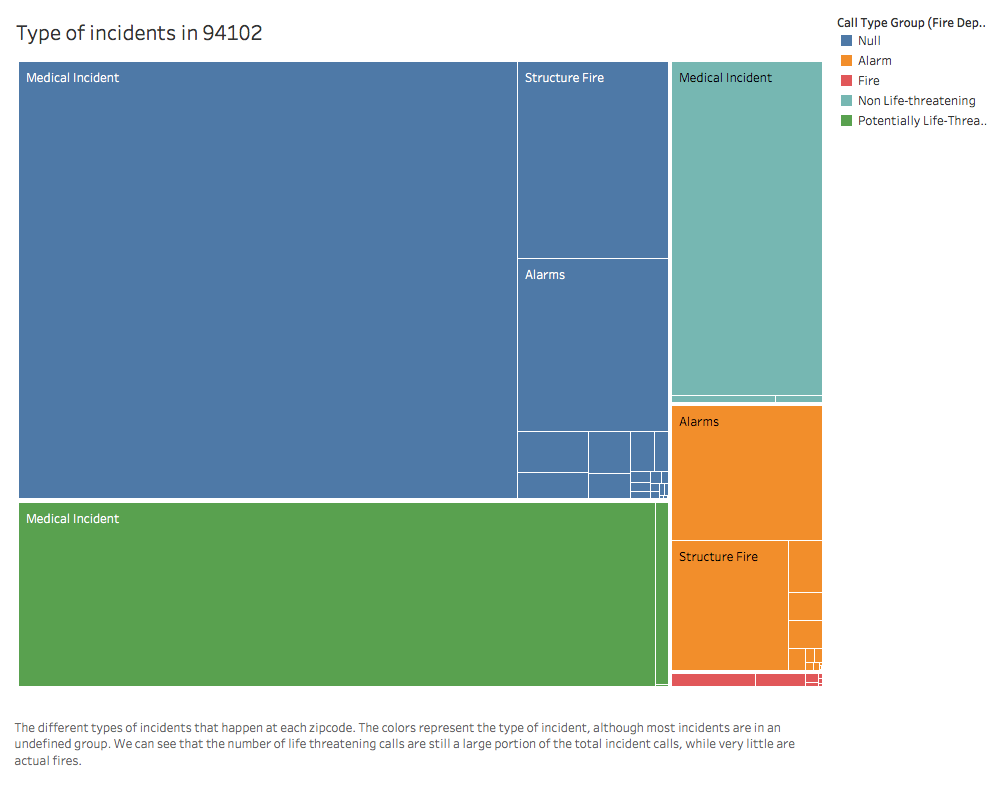
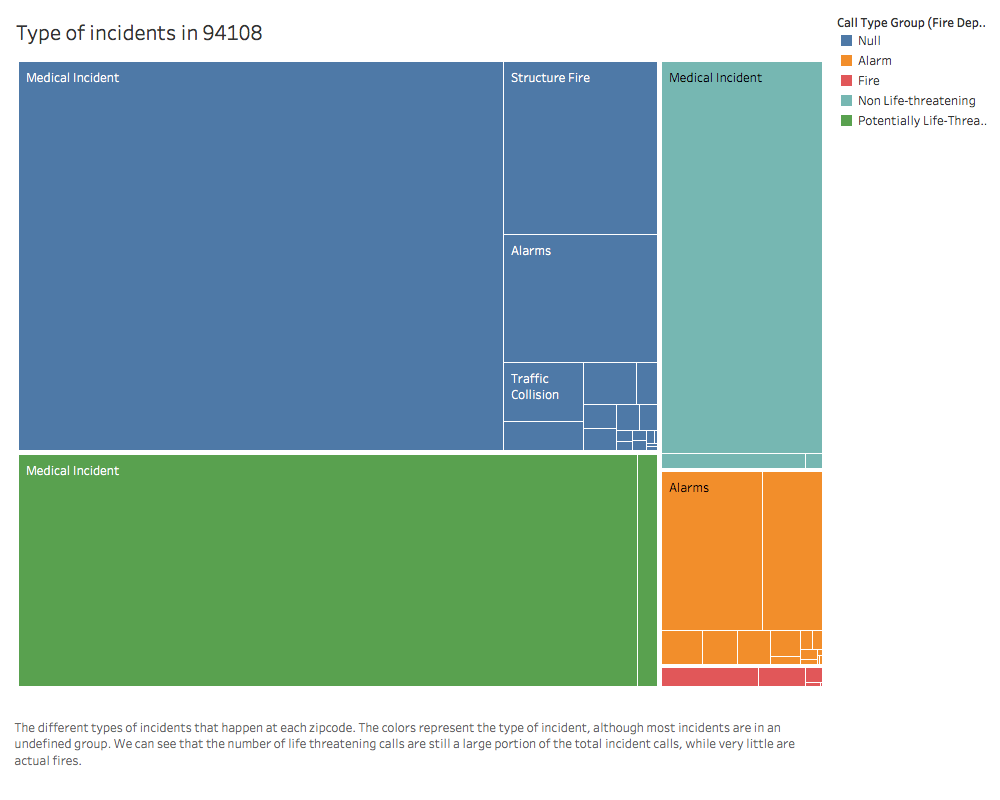
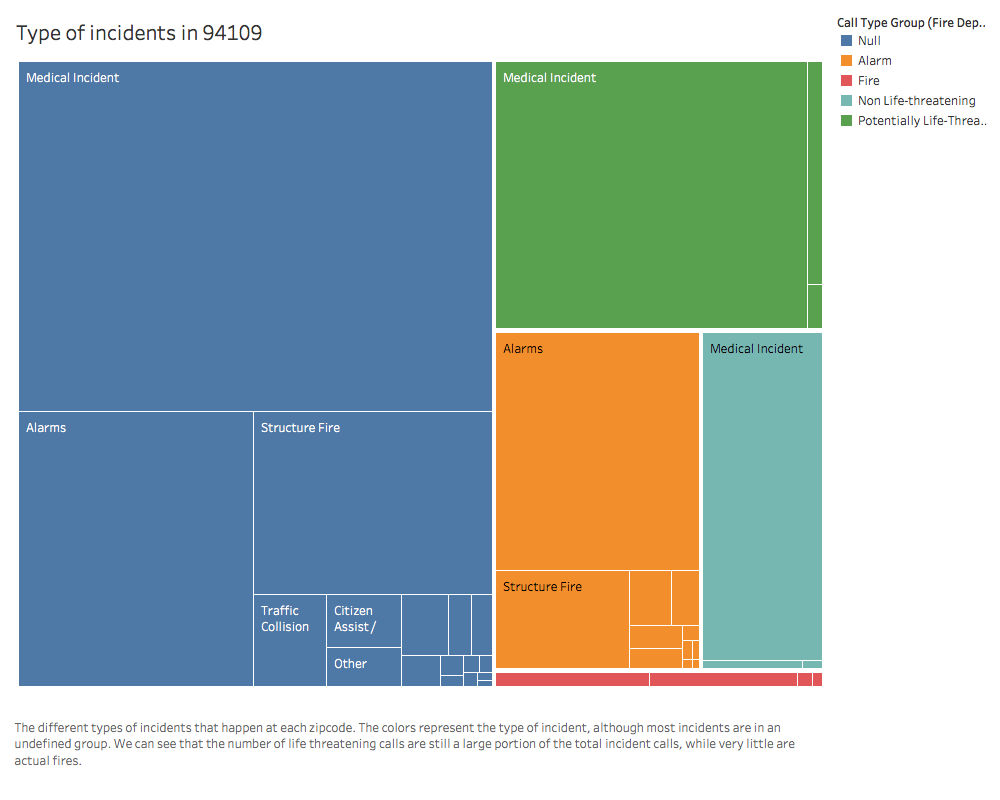
The 27 listed zip codes correspond to the 27 neighborhoods that we were given in the dataset. Continuing on with seemingly unexplicable delays in response times, we figured analyzing the types of calls that are reported would give insight.
The stacked bars represent the different types of calls in a certain zip code.
Even with adding the ability to see statistics through the years you can see that there hasn't been much change in almost half a decade. Nearly all neighborhoods have remained consistent with their crime rates, so the question still remains as to why there seems to be such a delay in certain areas.
Discussion
Using this data, we can analyze what types of incidents happen in which areas more often than others. This can give us insight in terms of why some areas simply demand a faster response time (i.e. due to more serious calls) or even display a potential existence of prejudice due to certain areas seemingly being neglected.
Credit
Data from: SF Fire Department Calls for Service.