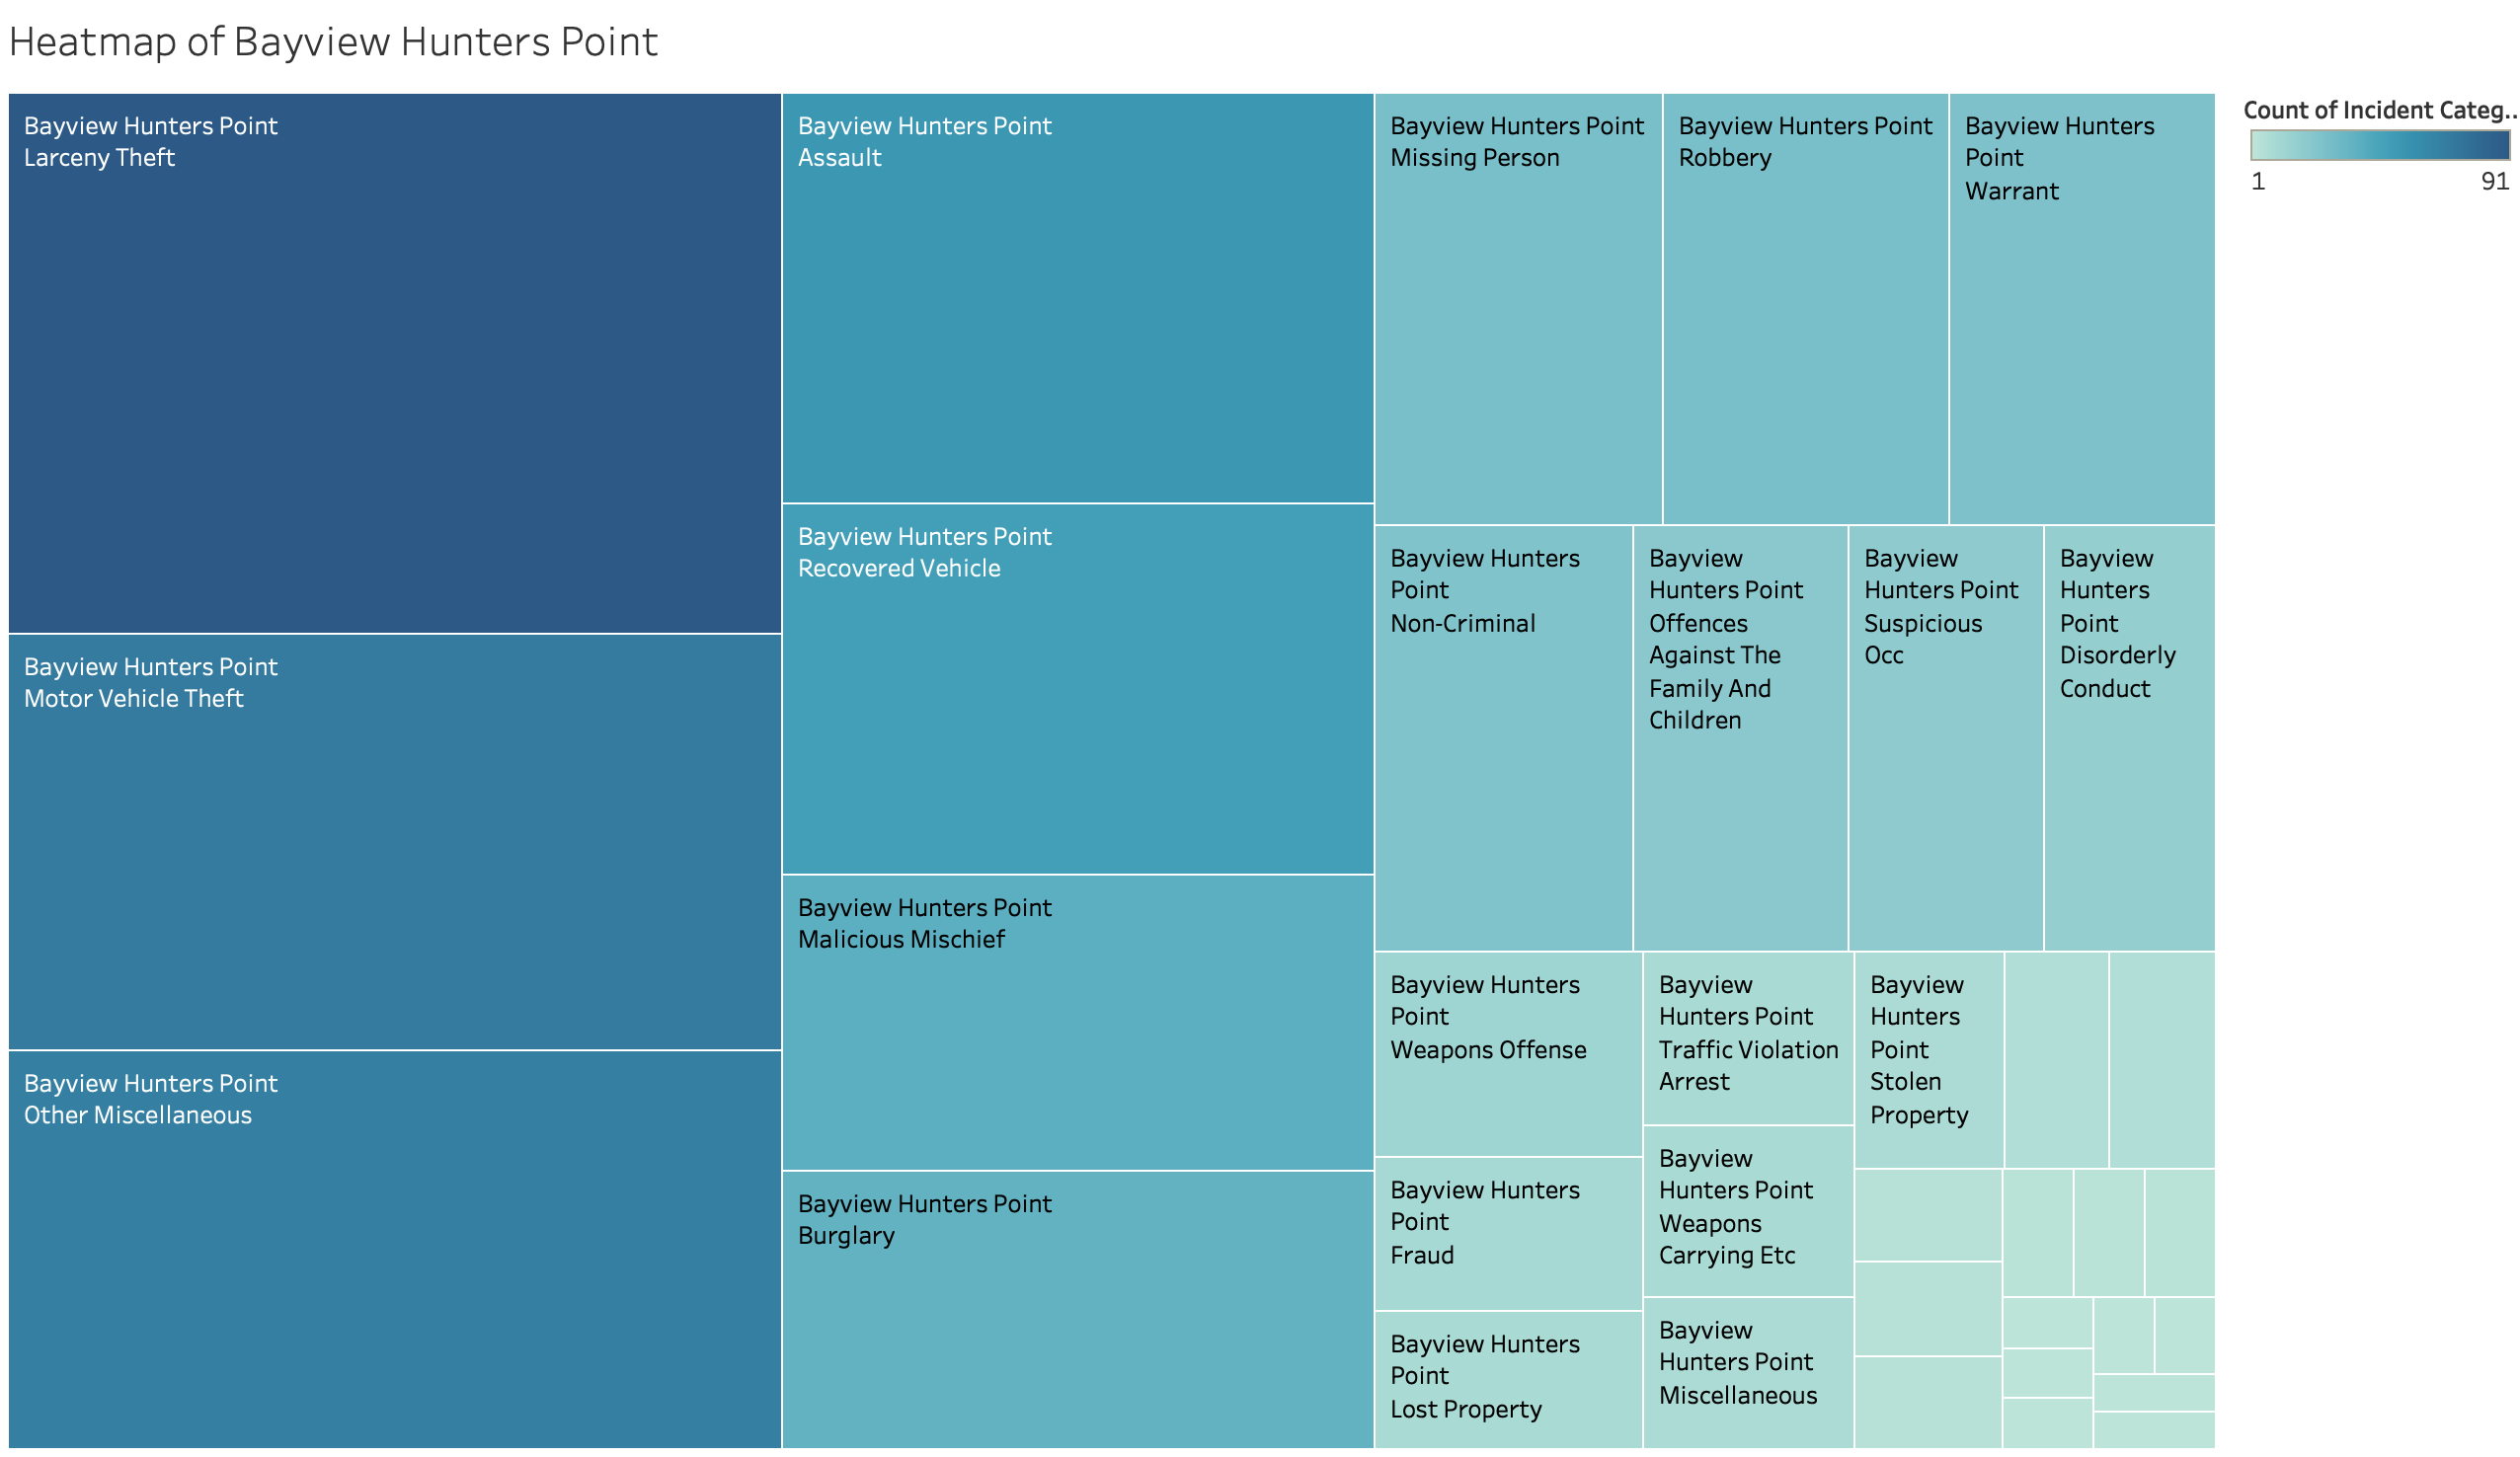
Incidents by Neighborhood
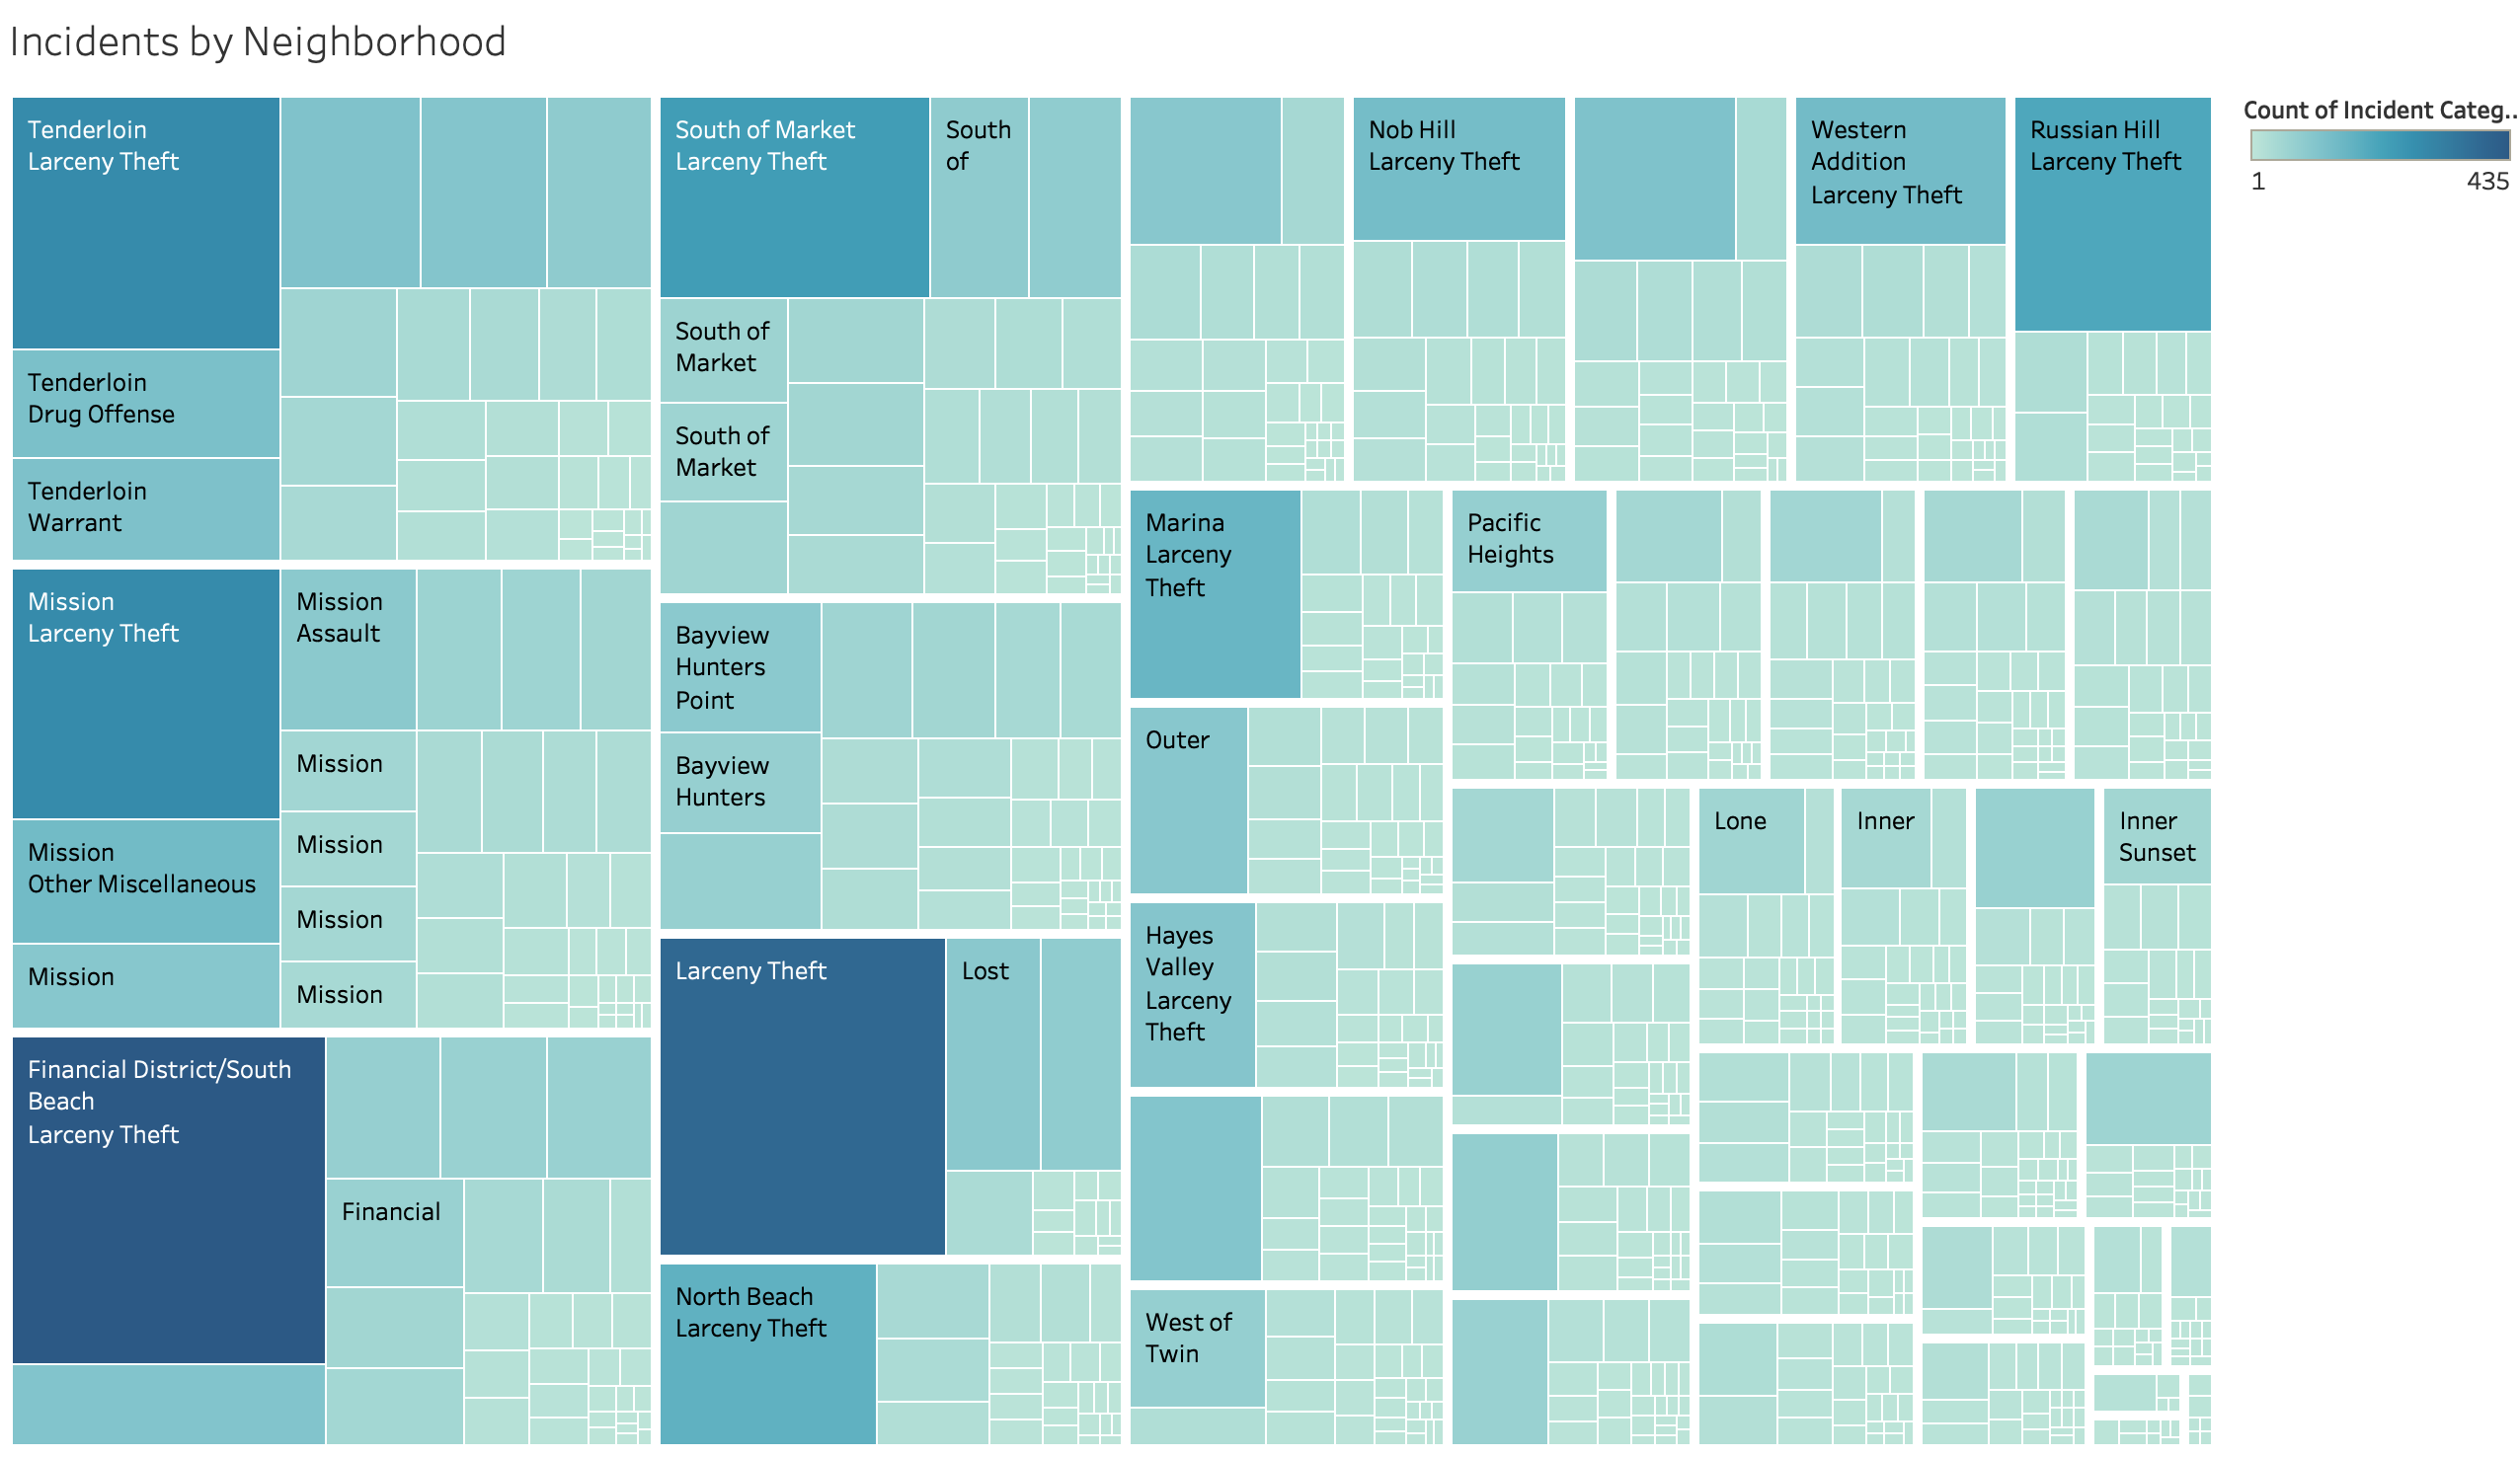
About this Visualization
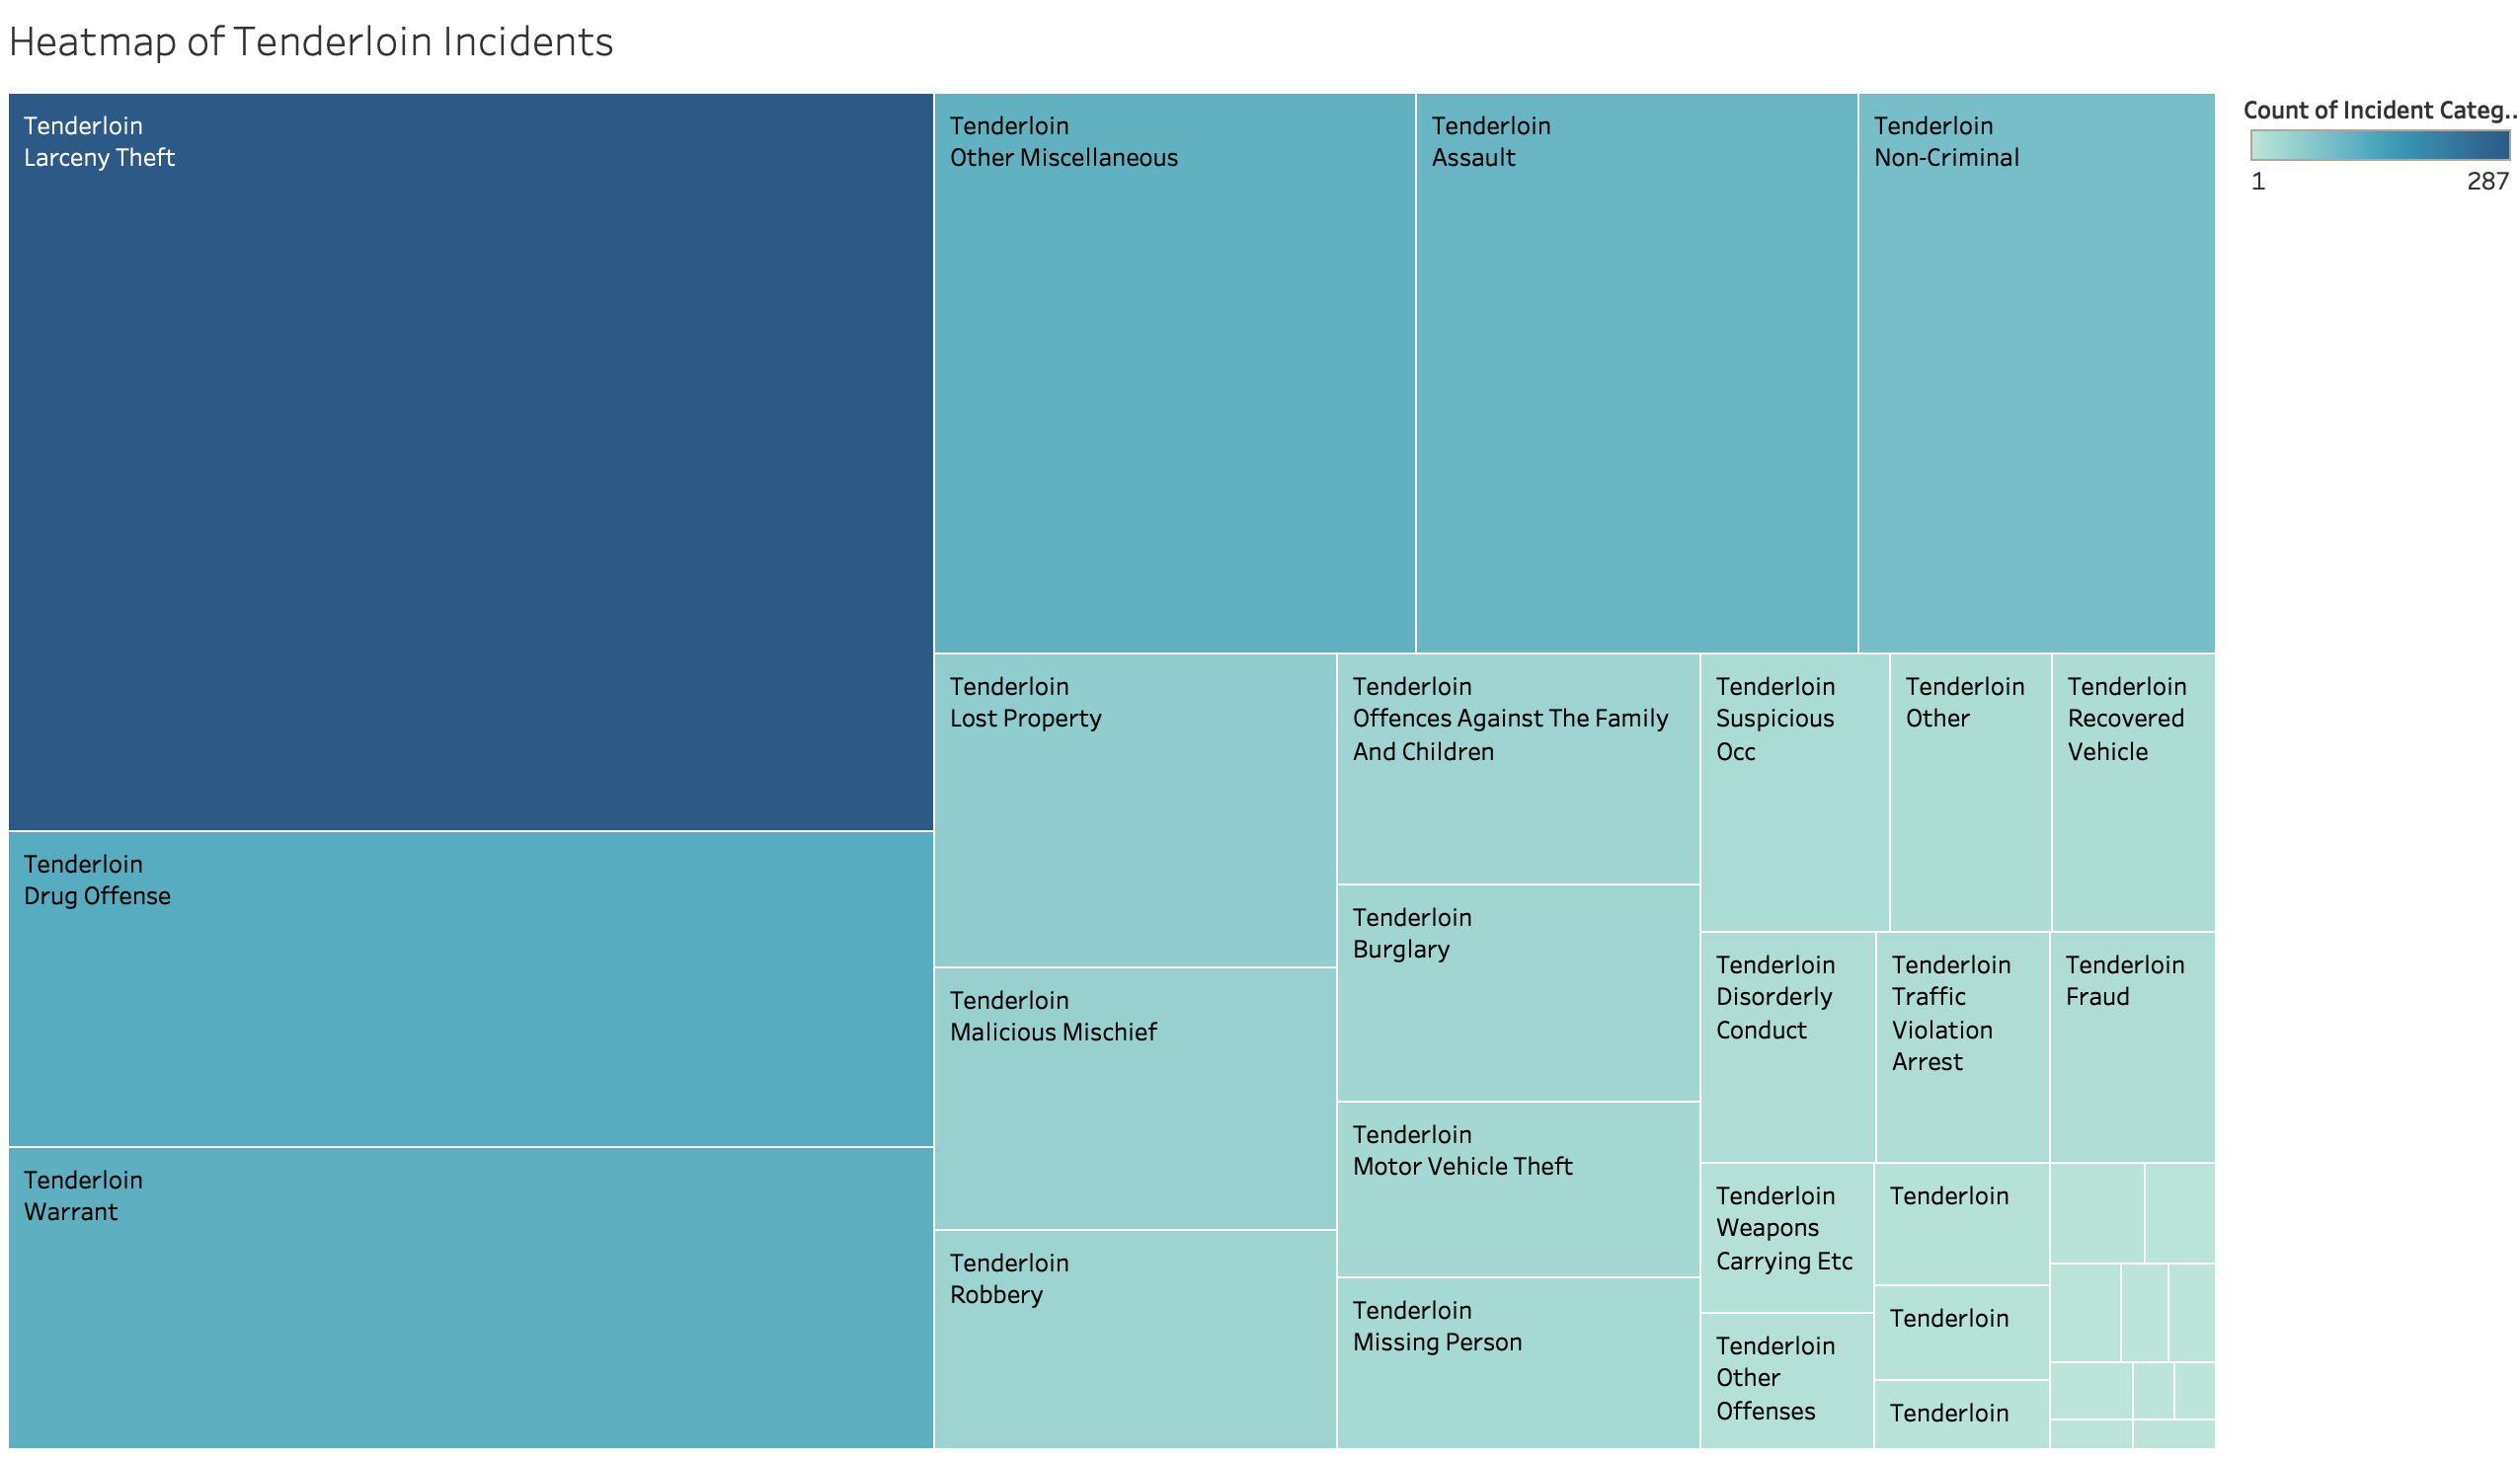
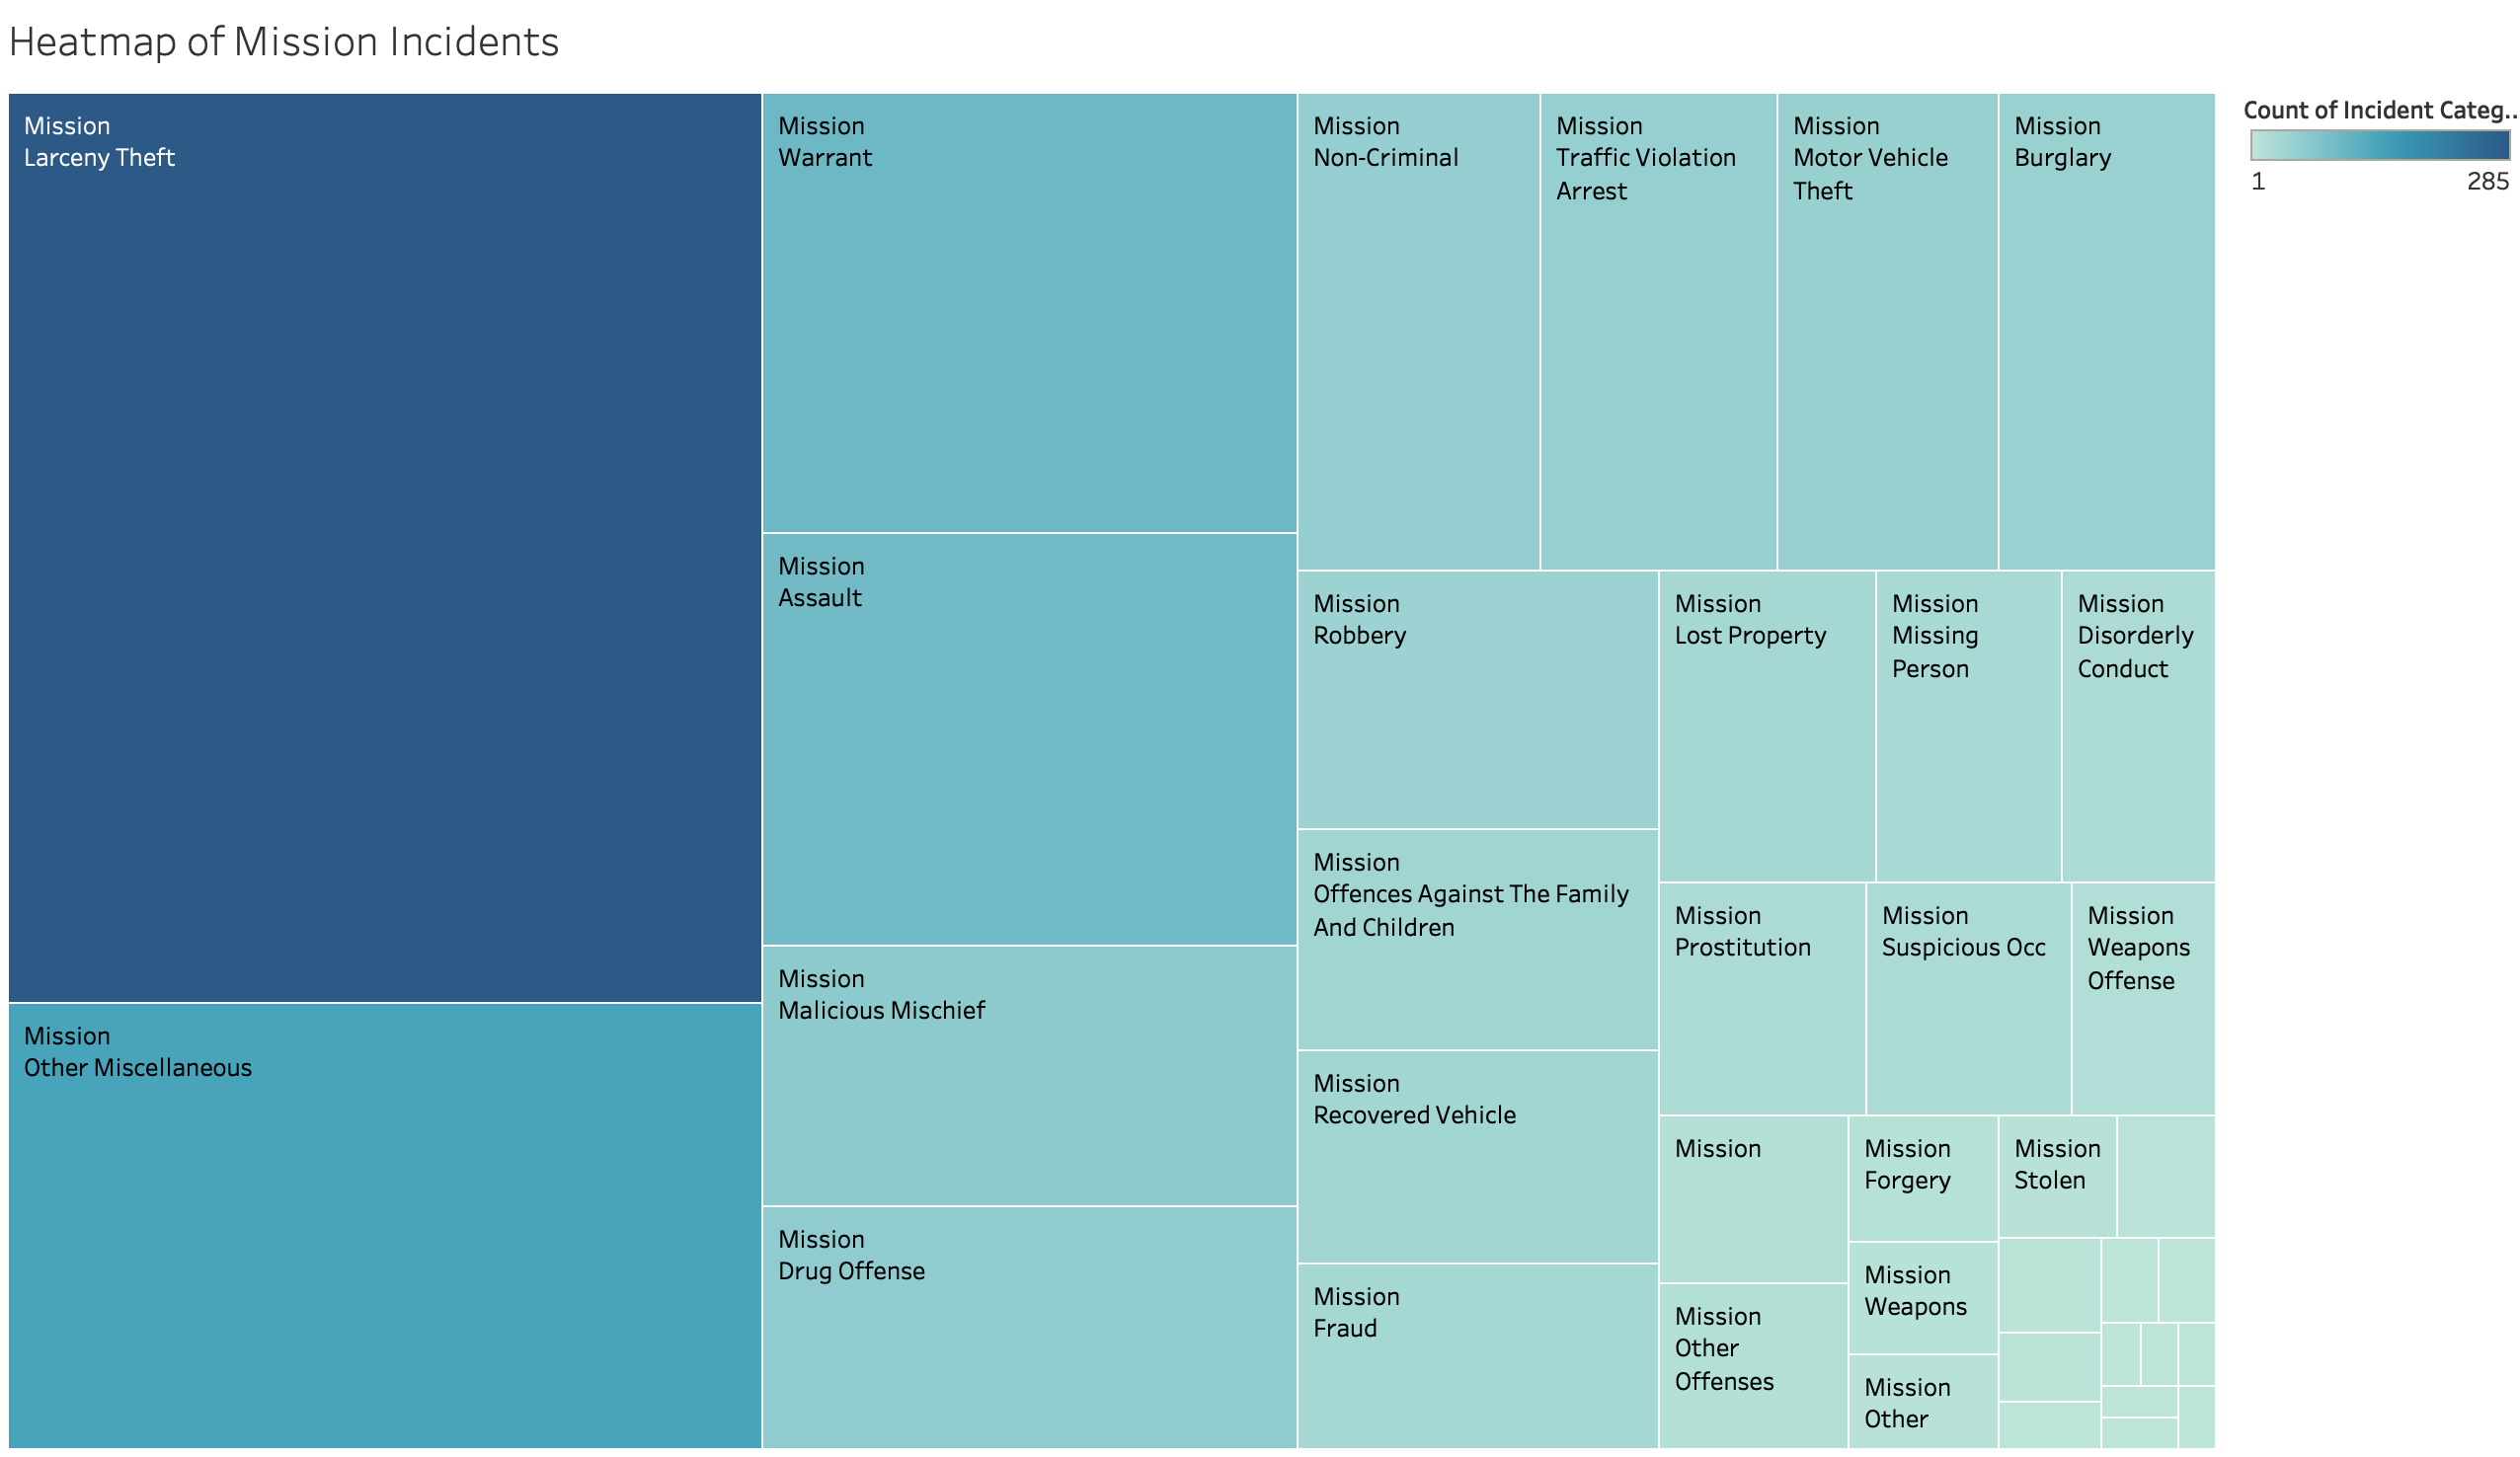
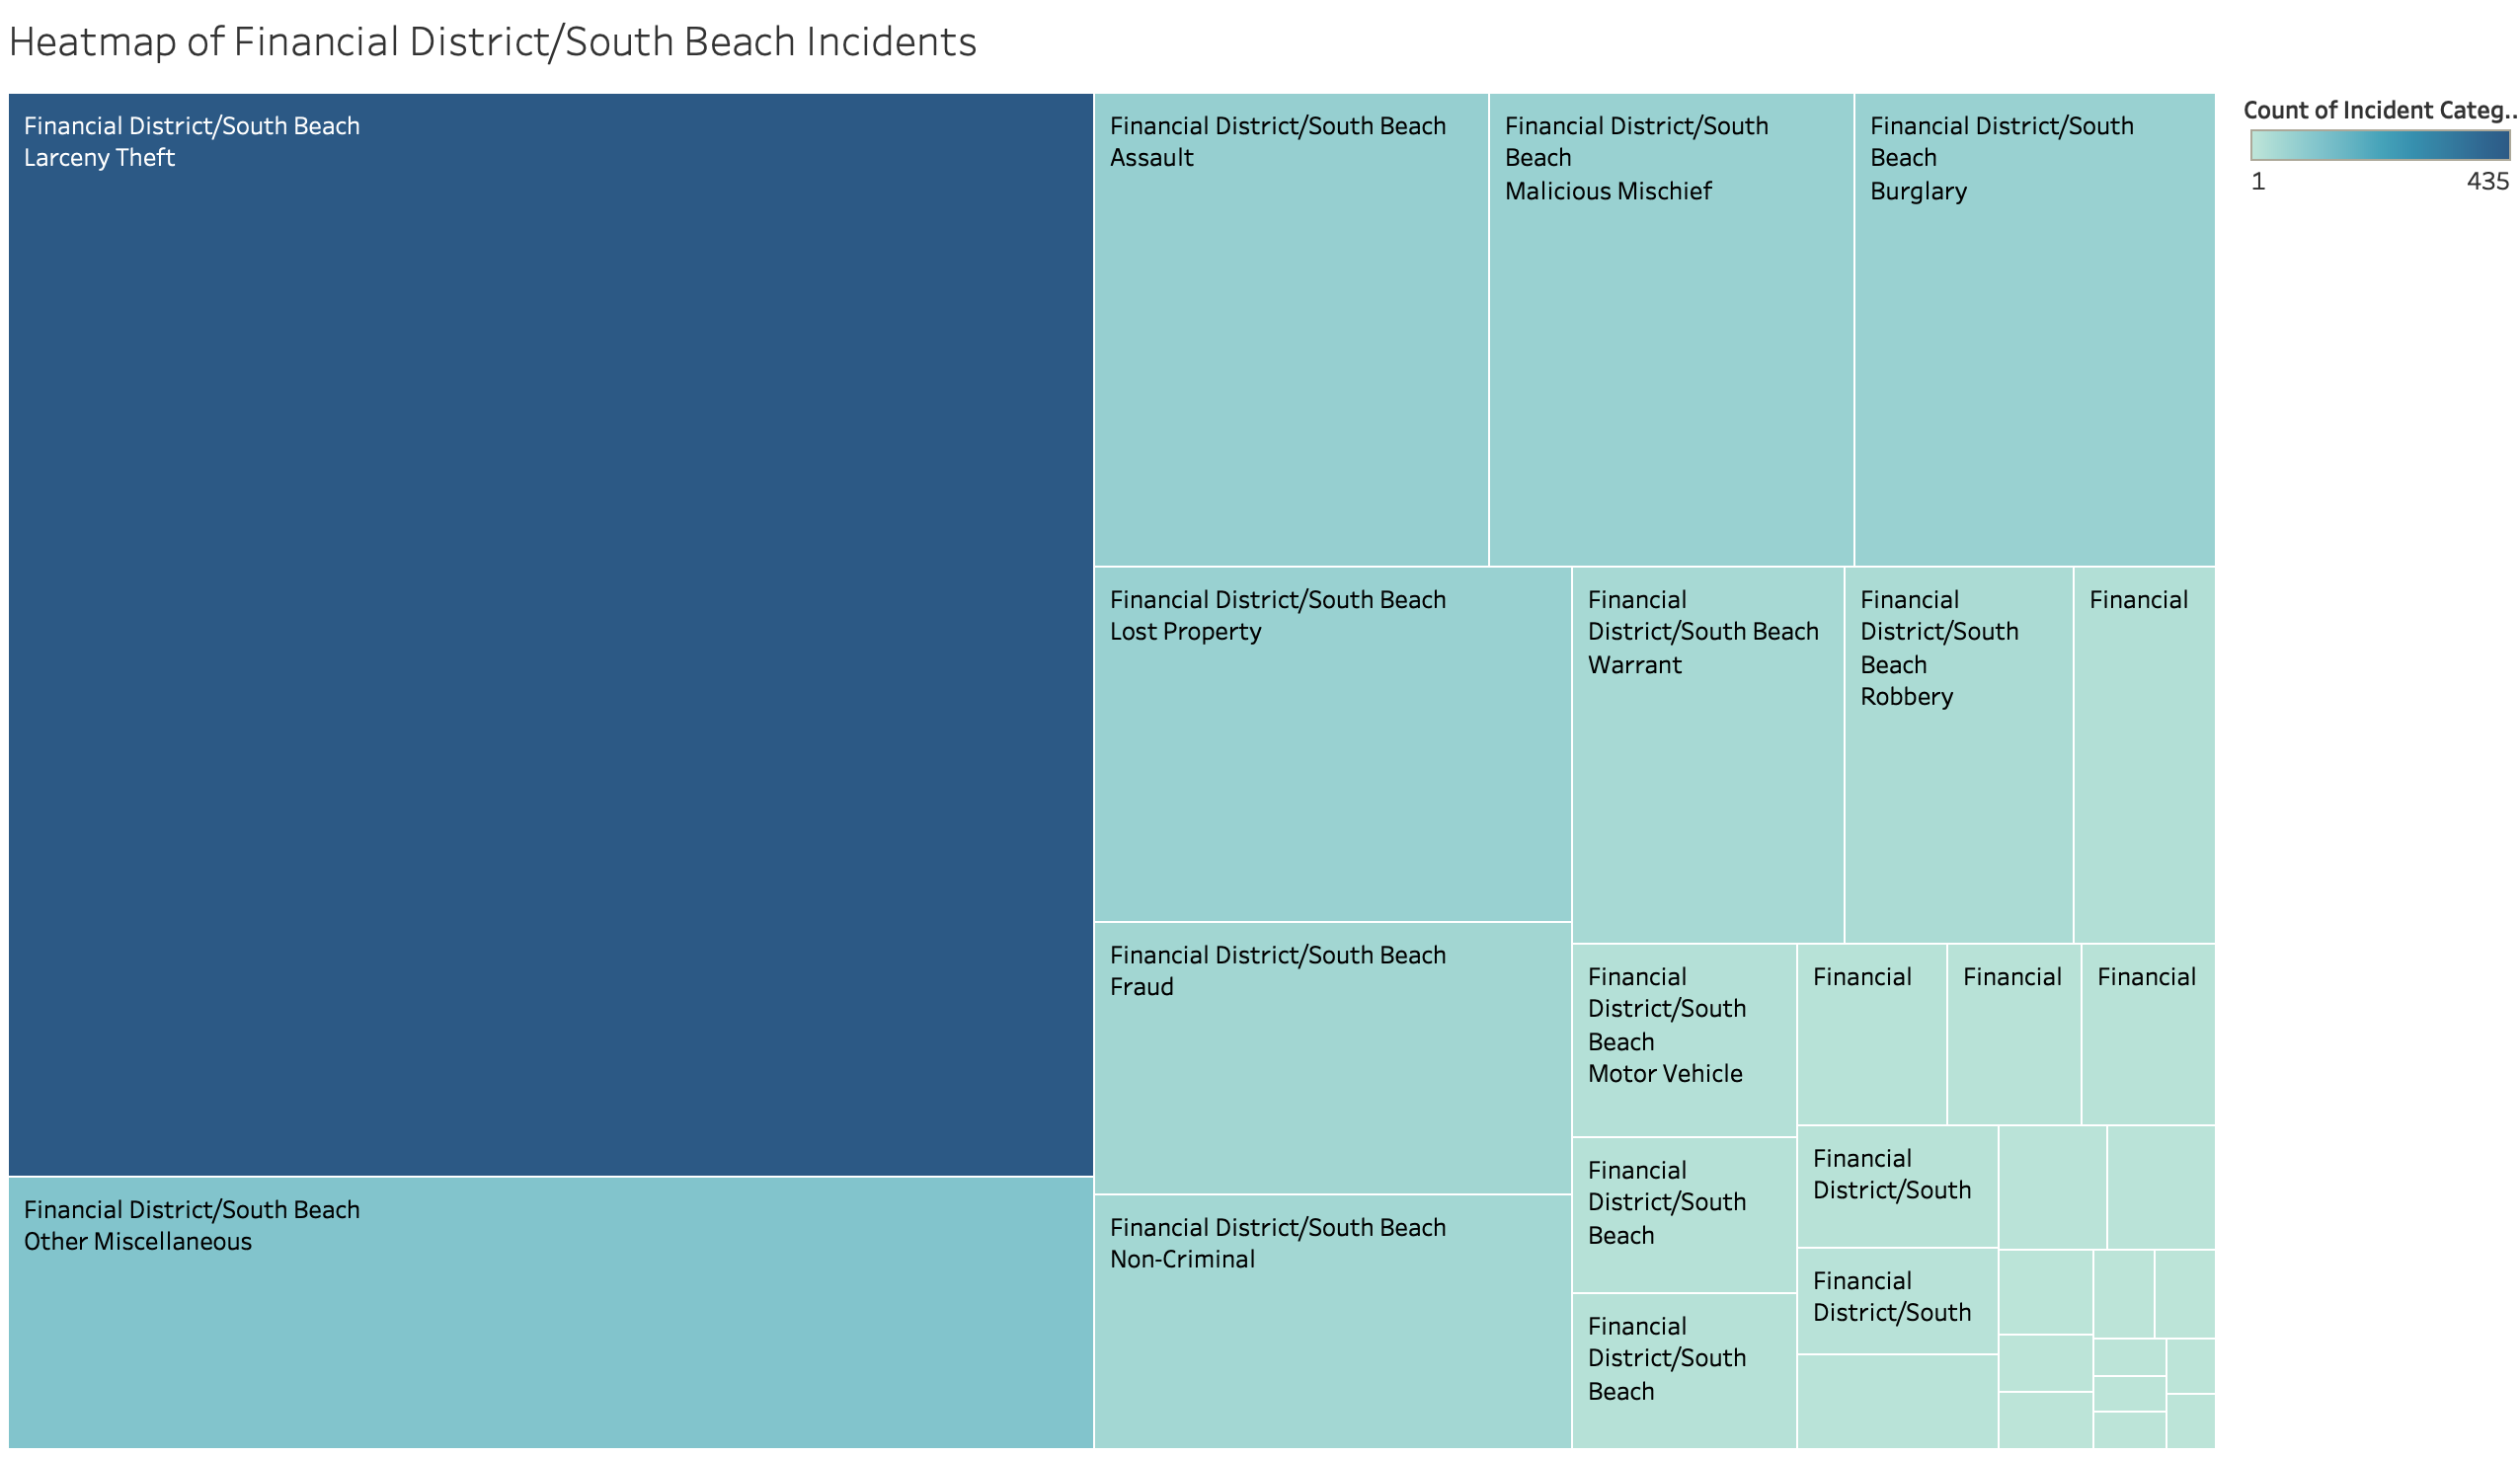
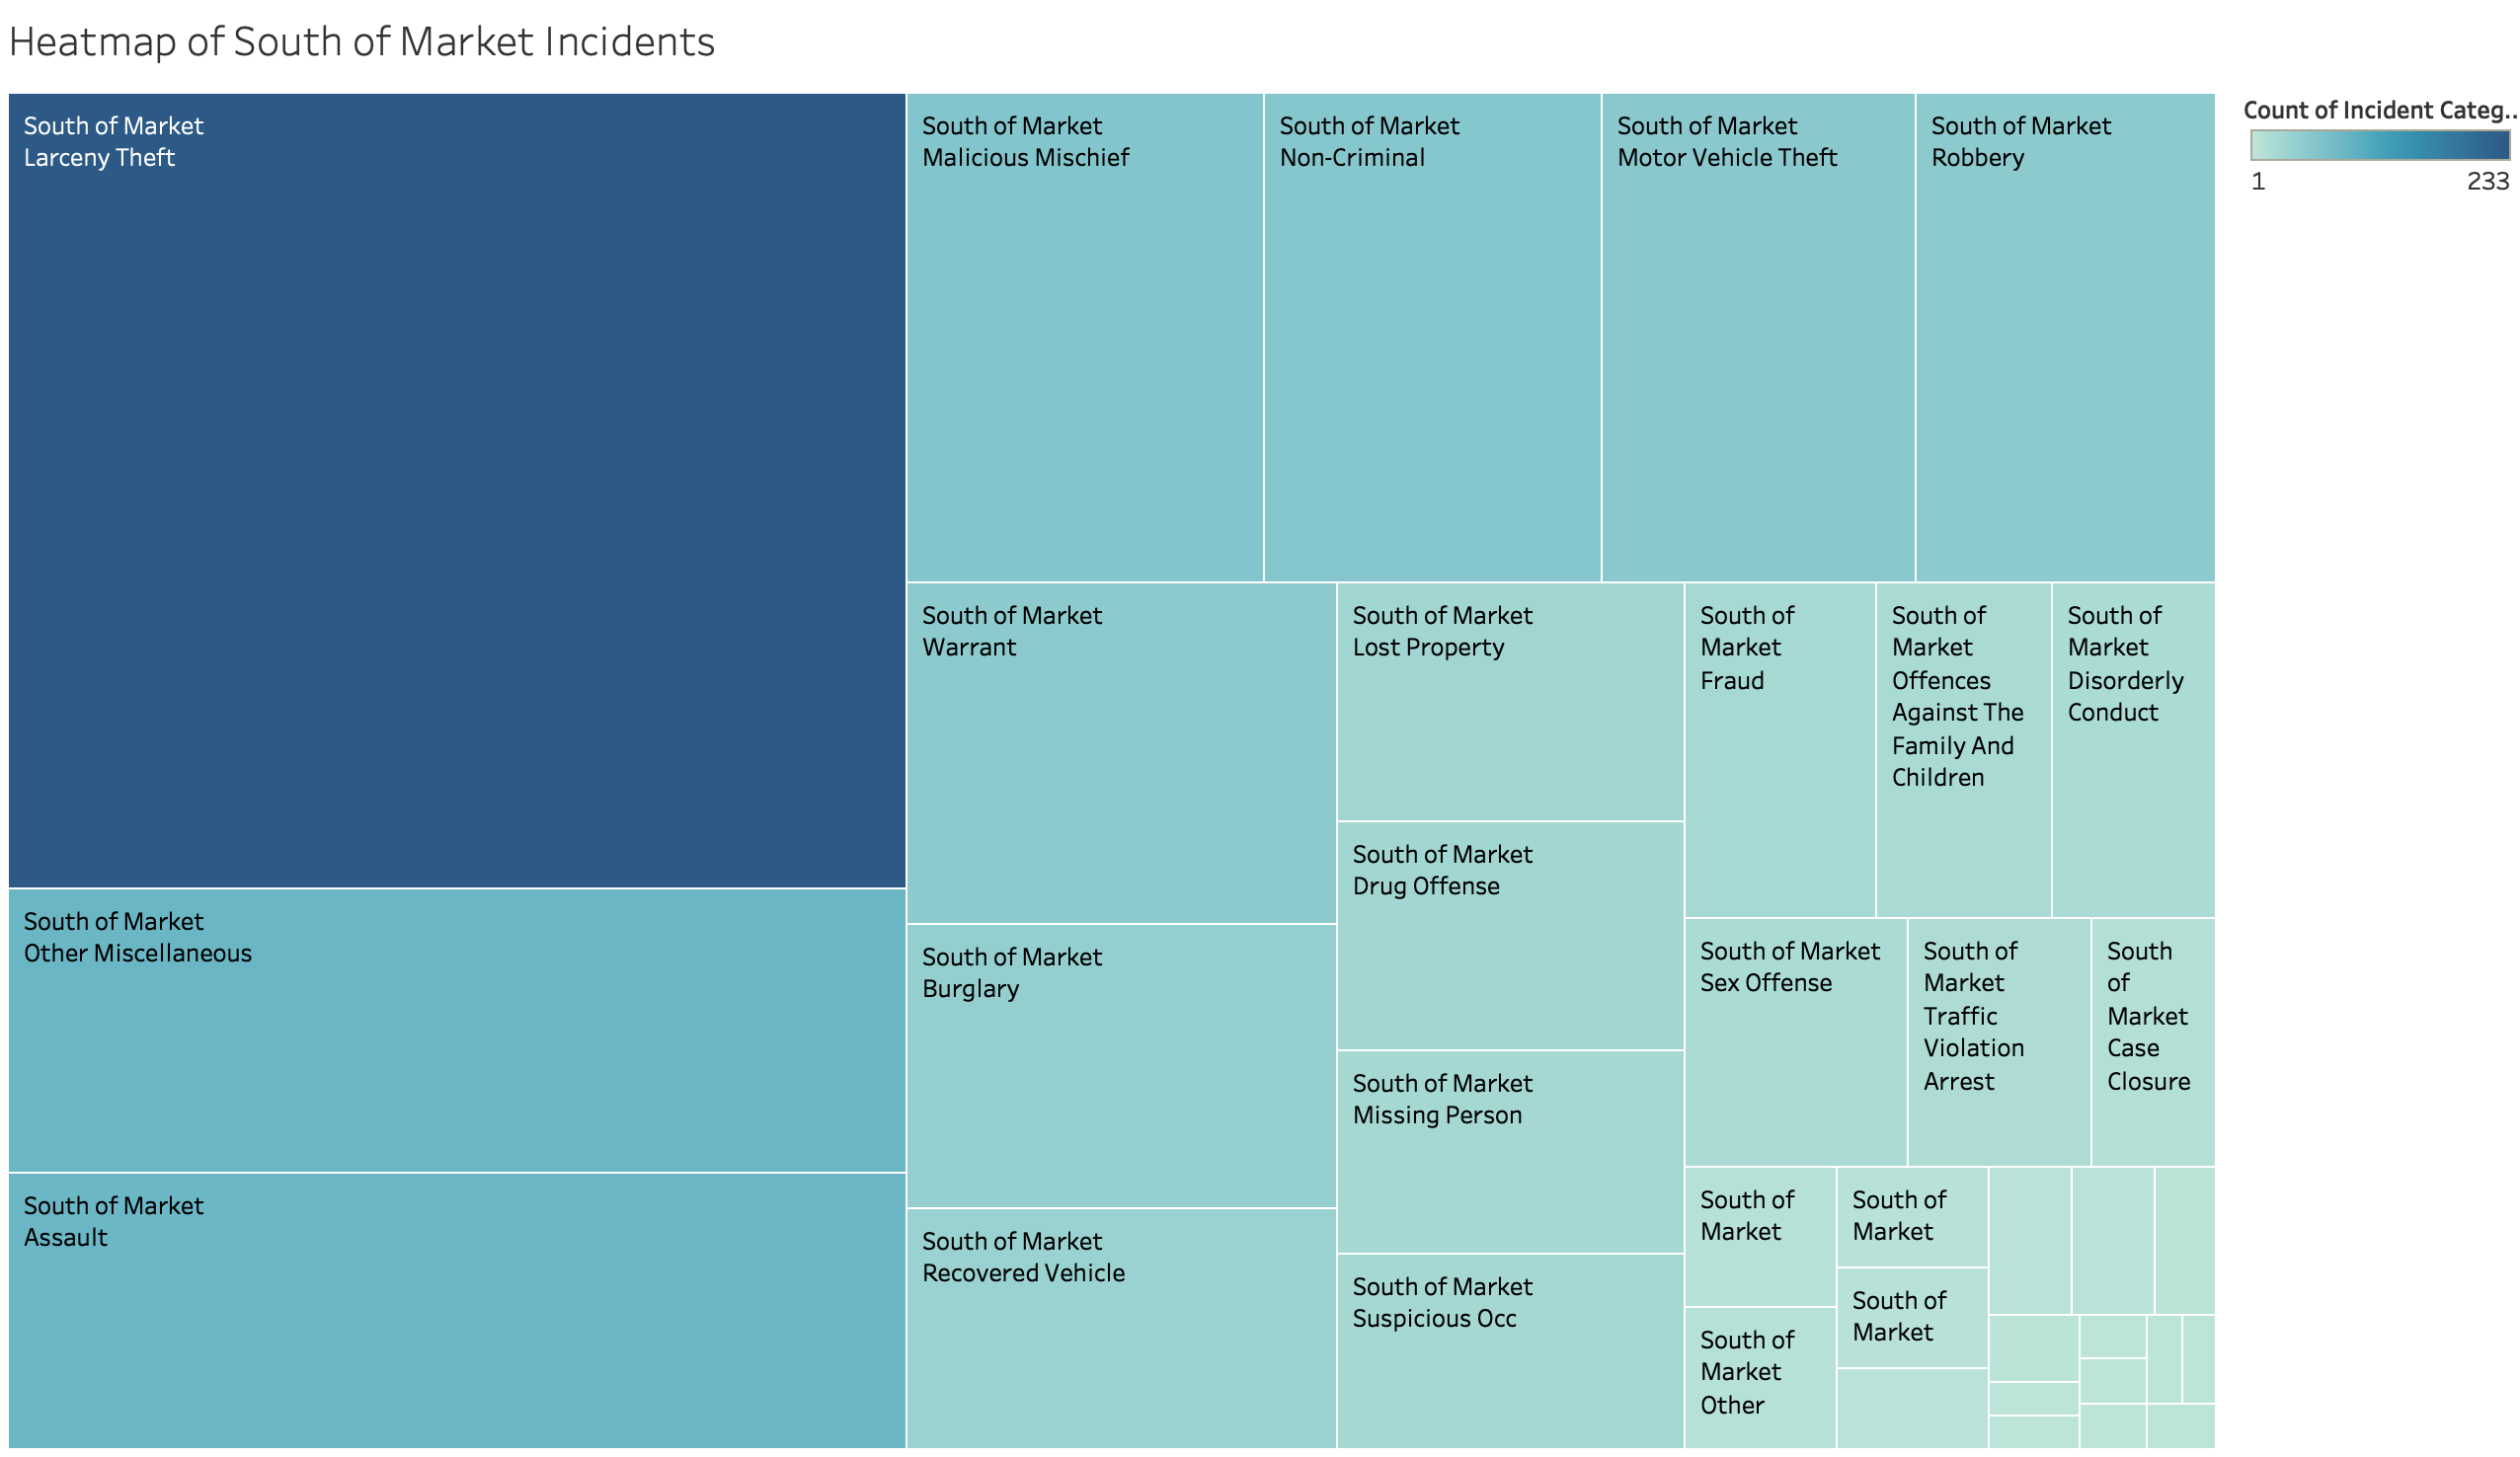
This Treemap visualization's purpose is to assertain what is the main type of incident recorded in each neighborhood. This can help citizens be more aware of what is the most common crime for each area in San Francisco, and be cautious as needed. This is a Treemap visualizing the hierarchy of the categories Analysis Neighborhood and Incident Category from the dataset. The color of the dataset represents the count of the Incident Category for each Analyis Neighborhood. The hierarchical levels of Analysis Neighborhood and Incident Category create visual clusters of SF neighborhoods through subdivisions based on the type of incident recorded. This treemap was created with the help of Tableau
The charts below are intended to look into the top 5 neighborhoods with the most SFPD incidents in 2018.
Breakdown of Neighborhoods
