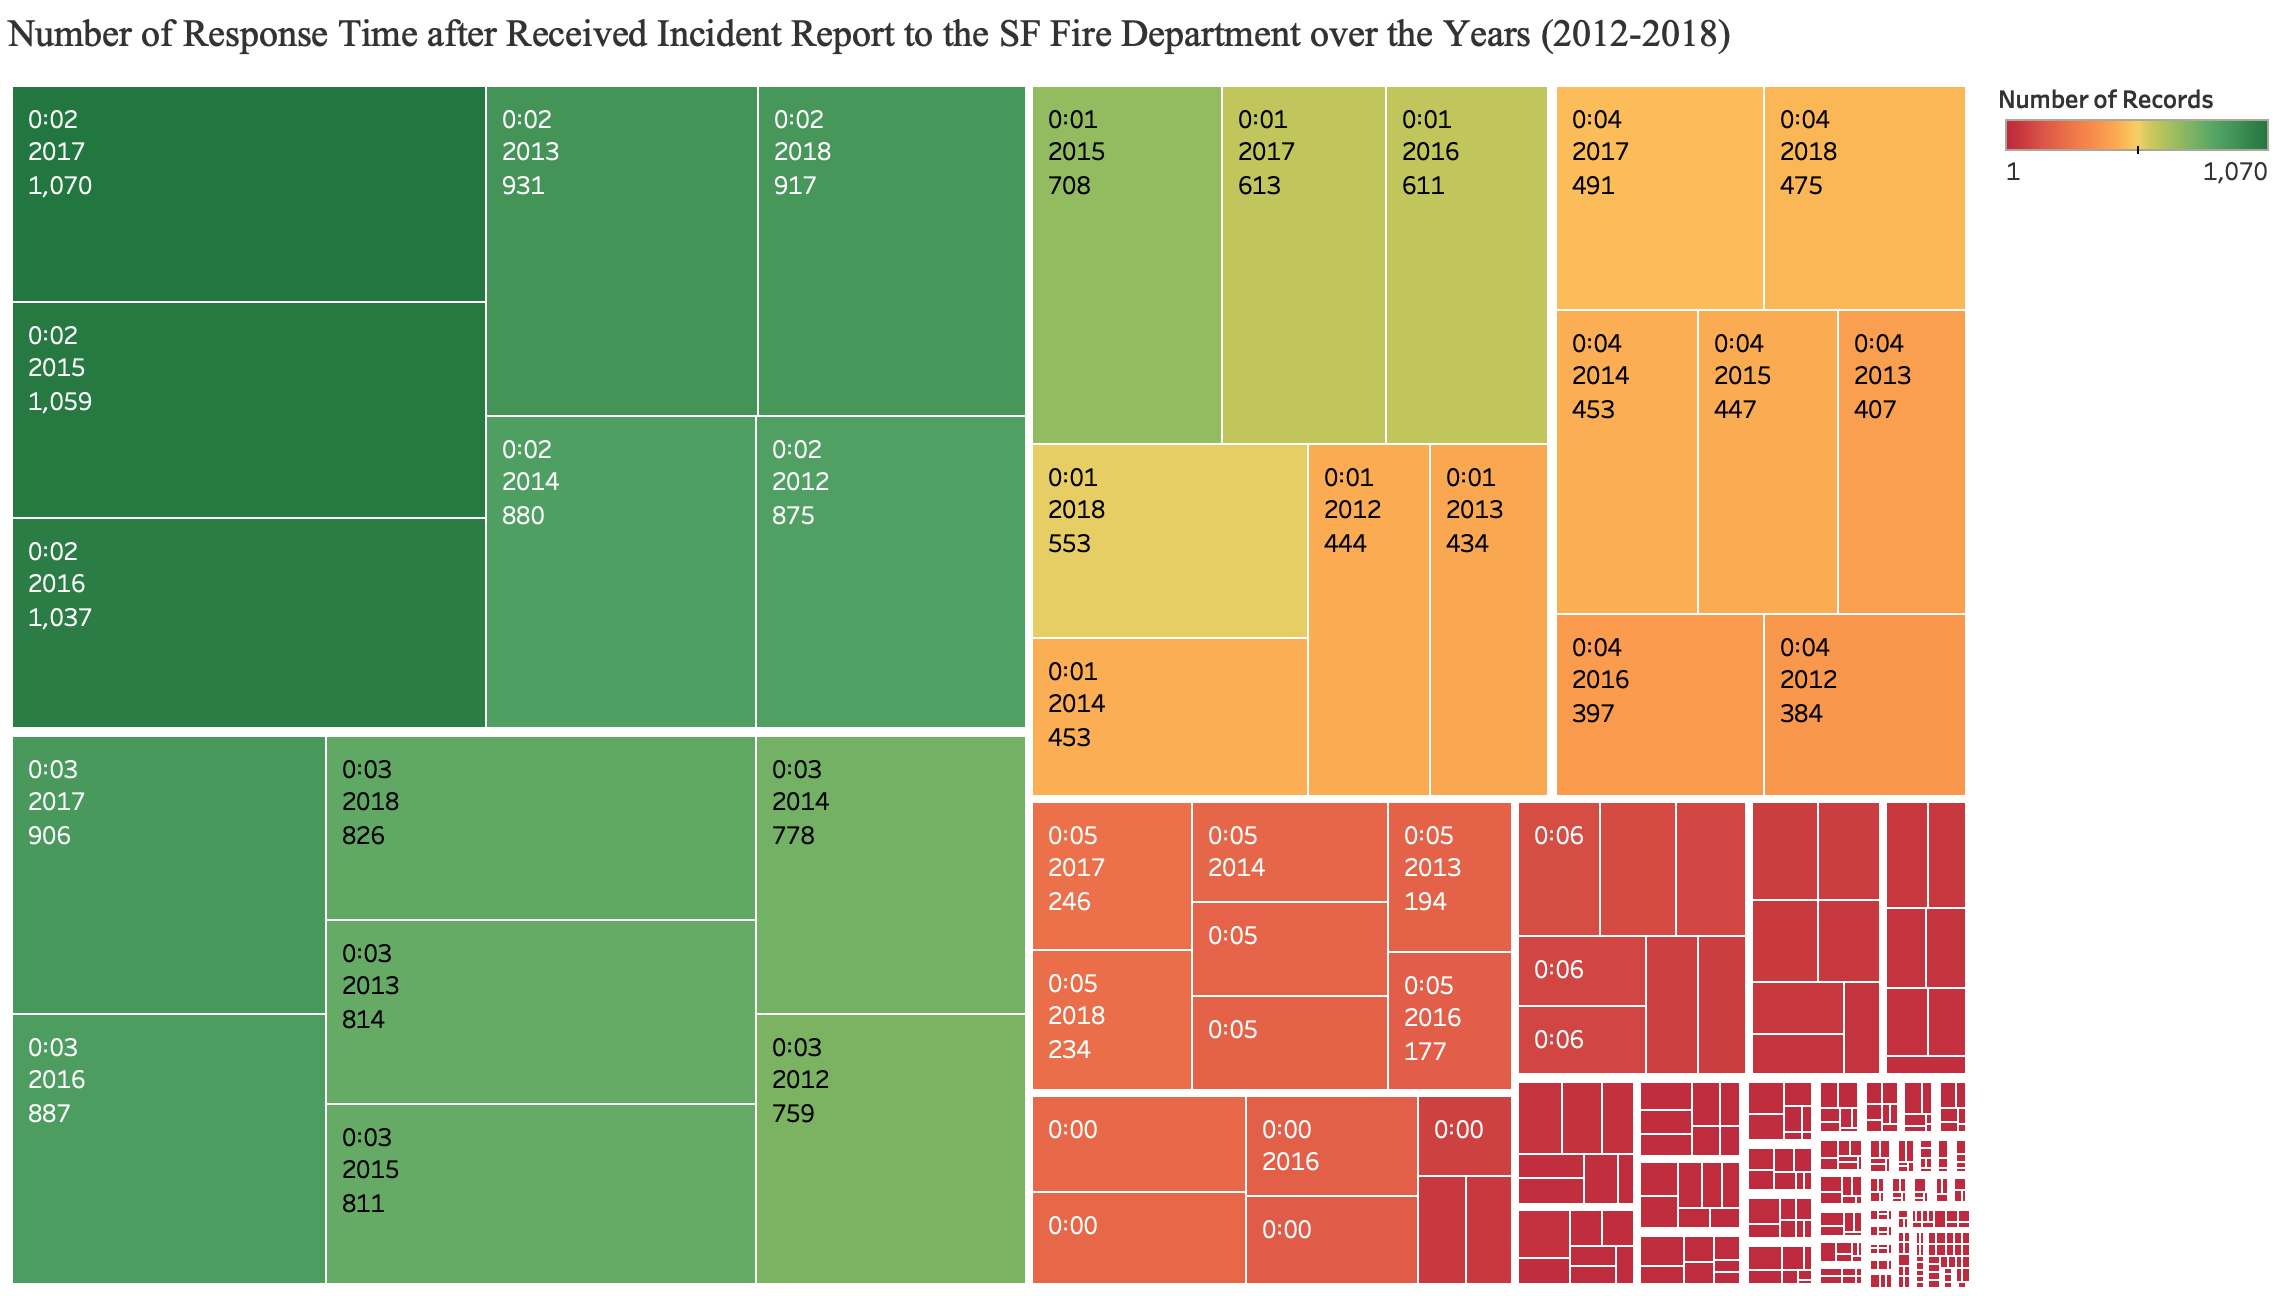
David's Prototype 1
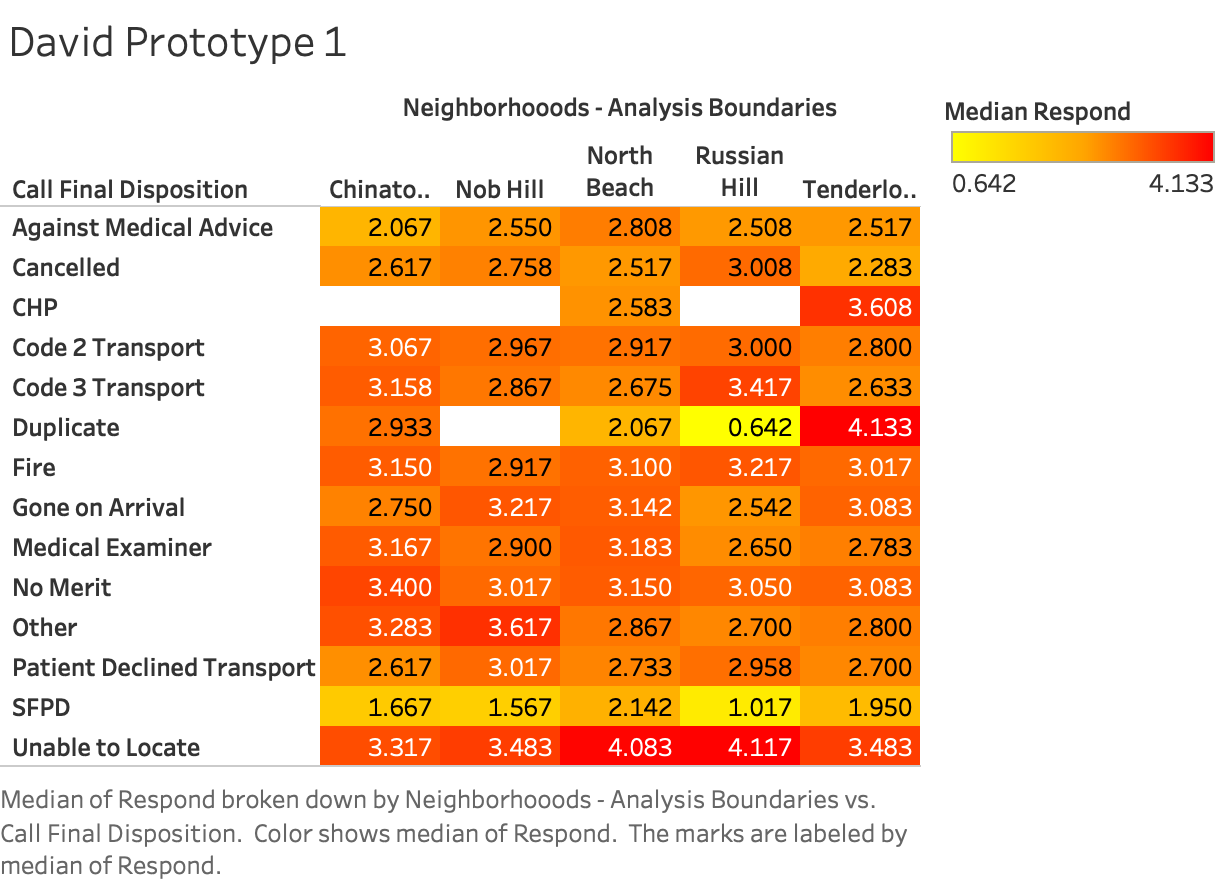
David's Prototype 2
Yen Dah Hsiang Prototype
Nico's Prototypes
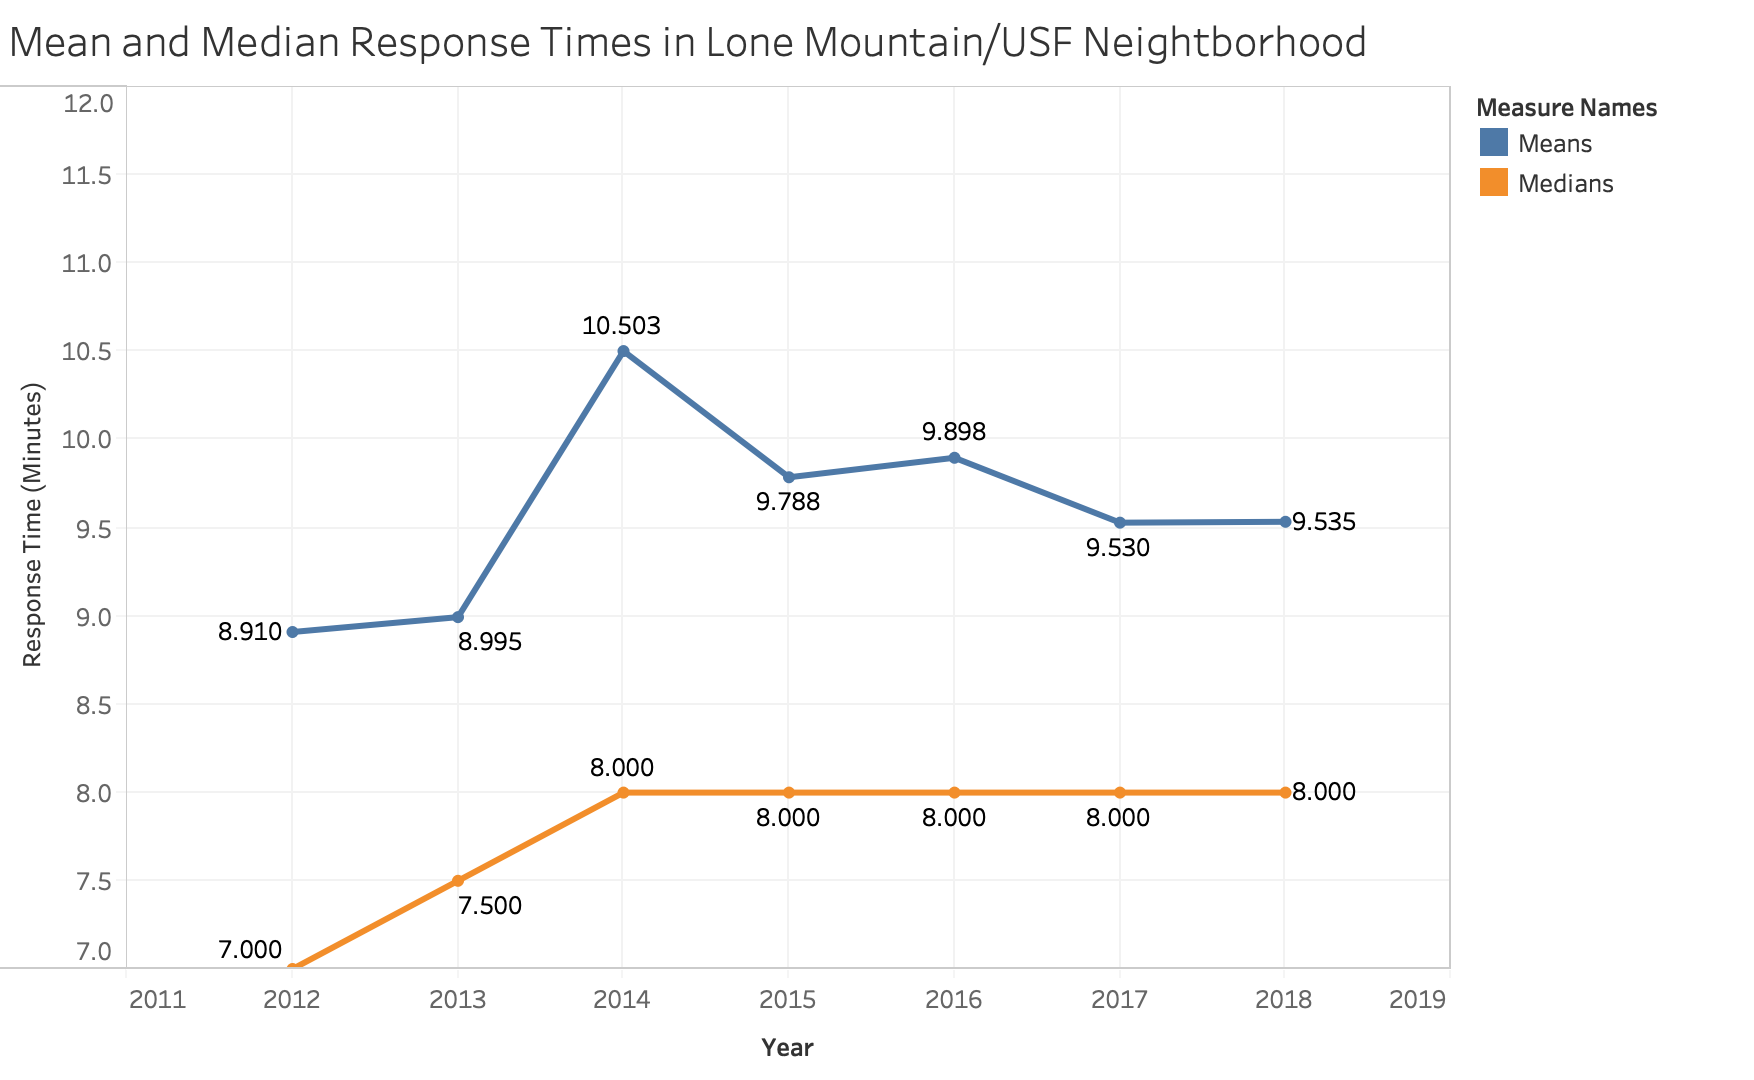
This is my original prototype for the beta release. At this point our group was focused on the 2012-2018 data for only the USF neighborhood. I knew that I wanted to implement a multi series line chart that showed the changes of different variables in the data. However, our group decided to expande the project to include more neighborhoods so I was able to implement a line chart that included the response times for multiple neighborhoods.
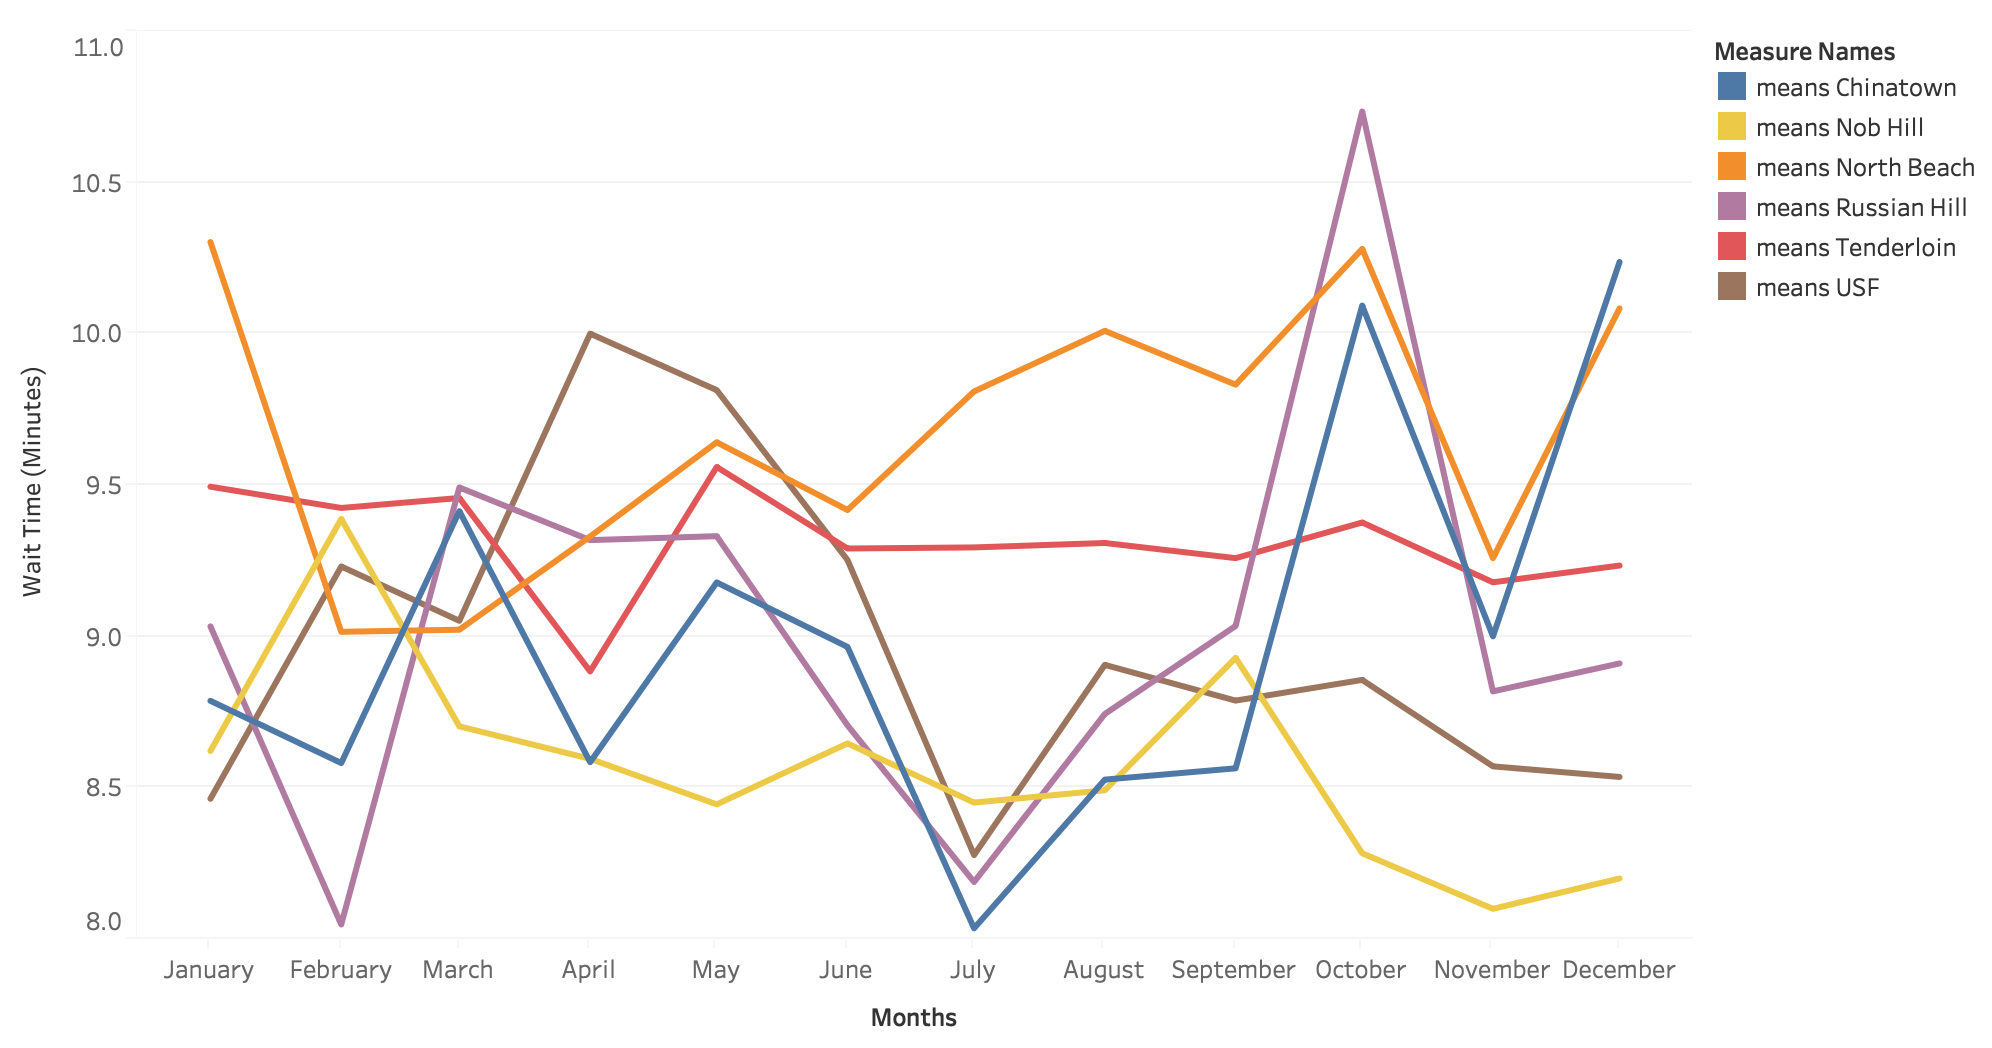
This is the updated prototype after our group expanded the scope of our data. This is a little more basic than what I ended up implementing in d3, but it gave me an idea of what I wanted to do.
Kim's Prototype